Download
1 / 30
300 likes | 428 Vues
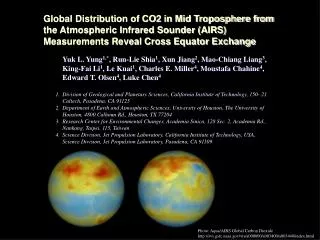
Global Distribution of CO2 in Mid Troposphere from the Atmospheric Infrared Sounder (AIRS) Measurements Reveal Cross Equator Exchange.

E N D
Global Distribution of CO2 in Mid Troposphere from the Atmospheric Infrared Sounder (AIRS) Measurements Reveal Cross Equator Exchange • Yuk L. Yung1,*, Run-Lie Shia1, Xun Jiang2, Mao-Chiang Liang3, King-Fai Li1, Le Kuai1, Charles E. Miller4, Moustafa Chahine4, Edward T. Olsen4, Luke Chen4 • Division of Geological and Planetary Sciences, California Institute of Technology, 150- 21 Caltech, Pasadena, CA 91125 • Department of Earth and Atmospheric Sciences, University of Houston, The University of Houston, 4800 Calhoun Rd., Houston, TX 77204 • Research Center for Environmental Changes, Academia Sinica, 128 Sec. 2, Academia Rd., Nankang, Taipei, 115, Taiwan • Science Division, Jet Propulsion Laboratory, California Institute of Technology, USA, Science Division, Jet Propulsion Laboratory, Pasadena, CA 91109 Photo: Aqua/AIRS Global Carbon Dioxide http://svs.gsfc.nasa.gov/vis/a000000/a003400/a003440/index.html
Outline • Models • Data • Transport
Seasonal Cycles Shia, Liang, Miller, Yung, GRL 2006
Mozart • Mozart (3D) • Boundary Condition
Outline • Models • Data • Transport
Outline • Models • Data • Transport
Summary • Data shows evidence for enhanced transport • Models shows CO2 transport in high troposphere • Transport sensitive to Kyy (small scale processes)
Table 1 Of the nearly 7 GT-C/yr net CO2 source created in N.H. 75% is transported into S.H. and 48% is absorbed by the surface of S.H. Sensitivity Tests, 20% reduction of : Kyy => 10% decrease of the cross equator flux Kzz => 4% PSI => 1% Distribution of S.H. sink 0-30 deg. S. 75% (source) 30-60 deg. S. 30% 60-90 deg. S. -5%
AIRS Science Team Meeting 2009 Yung et al., CO2Exchange Across the Equator