Download
1 / 1
10 likes | 122 Vues
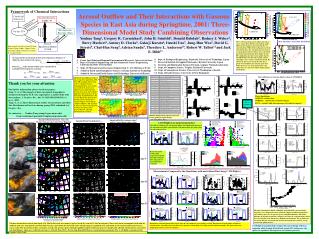
Cloud field Dobson O 3. Gaseous Reactions SAPRC-99. Gas-phase absorption Tropospheric O 3. Gaseous Loss. Photolysis Rates. On-line TUV. Heterogeneous Reactions (Dust). Gas-Aerosol Equilibrium interaction. Dust surface saturation. Aerosol Production. Aerosol Optical Properties.

E N D
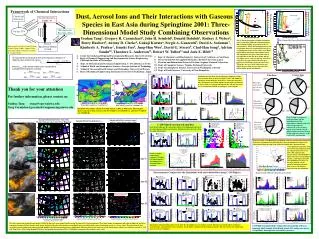
Cloud field Dobson O3 Gaseous Reactions SAPRC-99 Gas-phase absorption Tropospheric O3 Gaseous Loss Photolysis Rates On-line TUV Heterogeneous Reactions (Dust) Gas-Aerosol Equilibrium interaction Dust surface saturation Aerosol Production Aerosol Optical Properties Aerosol Equilibrium Module SCAPE Re-Colored by Coarse Dust Fresh Ratio The C-130 measurements of sulfate and nitrate coarse ratios show different correlations under different dust loading, represented by the Ca concentrations. When dust loading increased, the correlations show less variation and converge to a certain point related to dust coarse ratio. Both model and measurements show similar trends. The simulations also show some points that do not follow this trend. For these points, nitrate and sulfate coarse ratios are linearly related. Re-colored by the coarse dust fresh ratio, these points were identified as fresh (un-aged) dust. When dust was very fresh, both nitrate and sulfate increase their coarse ratios since they follow similar uptake mechanisms. Four aerosol size bins are used: 0.1µm-0.3µm, 0.3µm-1.0µm, 1.0µm-2.5µm, and 2.5µm-10µm (referred to as bins 1 to 4, respectively). To represent the involvement of dust in heterogeneous chemistry we define the dust surface fresh ratio as where Caactive is the amount of dust active calcium that is available for heterogeneous reactions: Coarse Ions Fine Ions Simulated ions and their size distributions compared to filter measurements along on the DC-8 flight 7 (left), and simulated variations (down) along the trajectory A. Along this trajectory, SO2 condensation and sulfate uptake on fine mode repel nitrate to coarse mode. Aerosol consideration in the 3-D also corrected the overestimation of HNO3 by adding its aerosol uptake. When The trajectory B passed over Shanghai When The trajectory B arrived at the P-3 flight 9 The P-3 flight 9 encountered fresh city plumes and the simulation showed the composition evolution in fine and coarse modes along the trajectory B. As the air mass moved away from the city the sulfate portion increased in both the fine and coarse modes, as the result of SO2 condensation Simulated Total Dust below 3 km with Weather Stations where Dust Were Reported Simulated Sulfate (contour, µg/m3) and its Coarse Ratio (color-coded) Simulated Dust Fresh Ratio Dfresh GMS-5 Dust-Enhanced Image Observed fine mass percentages on P-3 flight 9 C-130 Flight 8 encountered aged dust Dust did not influence the sub-micron sulfate, but significantly increased the super-micron sulfate concentration. Sub-micron dust ages faster than the super-micron dust. Apr 7 NOAA research vessel Ron Brown performed extensive measurements during the ACE-Asia experiment. The following plots show the simulations compared to observations along the ship track (marked in Julian day). During the dust events (Julian day 101-103), both observation and simulation show ion enhancement in the coarse mode. The single particle measurements with ATOFMS of sulfate (m/z 165 corresponding to Na3SO4+), and nitrate (m/z 108 corresponding to Na2NO3+) in the super-micron sea salt particles indicating chemical processed sea salt, which is consistent with the simulation. Extracted model results along trajectory C (shown left) illustrating the dust aging process and composition variation. Apr 9 Simulated Total Ca (µg/std m3) TAS Total Ca (µg/std m3) Irregular Points Measurements Compared to the Simulations with and without Dust along C-130 Flight 6 Ship Ron-Brown Cruise Ca Increase Trajectory Date Difference from the Arrival Point Ca Increase Apr 11 C-130 Flight 6 & 7 Trajectory C Apr 13 C-130 Flight 8 Simulations with and without dust clearly show the dust influence on secondary aerosols. Dust increased total sulfate and nitrate concentrations, especially their coarse portions, but the high Ca loading repelled ammonia uptake. The dust storms also significantly increased aerosol extinction. Simulated Dust Fresh Ratio in the 400m level Simulated Sulfate Coarse Ratio in the 400m level Averaged Dust Concentration (µg/m3) Averaged in the layers below 3km The dust storms that occurred from April 4-14, 2001 in East Asia were named “perfect storm”by some ACE-Asia investigators. These dust storms accompanied with cold-air outbreak and were transported eastward. Dusts became aged (shown by dust fresh ratio) when passing over polluted areas and sulfate in the coarse fraction increased (i.e., coarse ratio). The interaction of dust, secondary aerosols and gaseous species through equilibria and heterogeneous processes significantly affected related species and aerosol size distributions, which was verified by aircrafts (C-130 and Twin Otter), NOAA ship (Ronald H. Brown), and ground measurements. The C-130 flight 6 encountered the strongest dust events. Framework of Chemical Interactions Dust, Aerosol Ions and Their Interactions with Gaseous Species in East Asia during Springtime 2001: Three-Dimensional Model Study Combining ObservationsYouhua Tang1, Gregory R. Carmichael1, John H. Seinfeld2, Donald Dabdub3, Rodney J. Weber4, Barry Huebert5, Antony D. Clarke5, Gakuji Kurata6, Sergio A. Guazzotti7, David A. Sodeman7, Kimberly A. Prather7, Itsushi Uno8, Jung-Hun Woo1, David G. Streets9, Chul-Han Song4, Adrian Sandu10, Theodore L. Anderson11, Robert W. Talbot12 and Jack E. Dibb12 • Center for Global and Regional Environmental Research, University of Iowa • Dept. of Chemical Engineering and Environmental Science Engineering, California Institute of Technology • Dept. of Mechanical and Aerospace Engineering, U. of California at Irvine • School of Earth and Atmospheric Sciences, Georgia Institute of Technology • School of Ocean and Earth Science and Technology, University of Hawaii • Dept. of Ecological Engineering, Toyohashi University of Technology, Japan • Dept. of Chemistry and Biochemistry, University of California at San Diego • Research Institute for Applied Mechanics, Kyushu University, Japan • Decision and Information Sciences Division, Argonne National Laboratory • Dept. of Computer Science, Virginia Technical University • Dept. of Atmospheric Science, University of Washington at Seattle • Dept. of Earth Sciences, University of New Hampshire A Thank you for your attention For further information, please contact us: Youhua Tang ytang@cgrer.uiowa.edu Greg Carmichael gcarmich@engineering.uiowa.edu P-3 #9 B DC-8 #7 B A Total Sulfate (g/std m3) in 400m level Total Nitrate (g/std m3) in 400m level Simulated total sulfate, nitrate at 6GMT, March 7, 2001 at 400m layer. The left plot shows trajectories that arrived at the DC-8 flight 7 at 8:45GMT (A), and the P-3 flight 9 at 6:55GMT(B). C-130 flight 6 encountered the strongest dust storm during ACE-Asia campaign, which strongly affected both aerosol (left) and gaseous species via equalibria, heterogeneous and radiative processes.