Download
1 / 13
130 likes | 456 Vues
COMBINED MULTI MODAL TRIP DISTRIBUTION AND MODAL SPLIT TECHNIQUE APPLIED IN THE EMME/2 TRANSPORT DEMAND MODEL FOR THE CITY OF TSHWANE. By Kerneels Olivier City of Tshwane Metropolitan Municipality. PURPOSE

E N D
COMBINED MULTI MODALTRIP DISTRIBUTION AND MODAL SPLIT TECHNIQUE APPLIED IN THE EMME/2 TRANSPORT DEMAND MODELFOR THE CITY OF TSHWANE By Kerneels Olivier City of Tshwane Metropolitan Municipality Emme2 Conference: 10-11 Spetember 2004
PURPOSE • To indicate by example how the trip distribution and modal split steps can be combined in Emme/2 to determine the external trips in an environment where limited data is available Emme2 Conference: 10-11 Spetember 2004
PROBLEM DEFINISION • It is difficult to isolate an area from the rest of the world, without having data on the interaction between the modelled area and the rest of the world • In Tshwane, a substantial number of daily commuters enter Tshwane from Kwan-Debele and areas to the north-west that cannot be ignored. Further, there is also a heavy interaction between Tshwane and the South (Midrand and Johannesburg etc) • At the time the regional provincial transport demand model could not provide the necessary information (It is currently in the process of re-development). Emme2 Conference: 10-11 Spetember 2004
Fortunately data from the following were available: • Tshwane 1998 home interview travel survey (home side) • Limited employment survey (employment side) and • External cordon counts (road and rail base). Emme2 Conference: 10-11 Spetember 2004
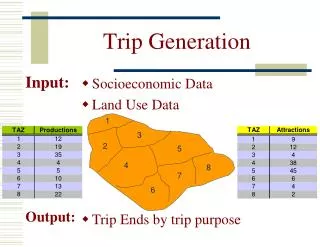
TRIP GENERATION • The EXTERNAL person trip productions and attractions were derived from the outside cordon traffic survey data. Note all trips are specified per transport mode (car, bus, taxi and train) • The INTERNAL person trip productions and attractions were determined based on socio-economic data (population and employment figures), income groups, as well as general trip making characteristic per traffic region (derived from the home interview survey results) • These INTERNAL trips were subsequently divided into internal-to-internal, internal-to-external and external-to-internal trip matrices based on current transport patterns (home-interview and employment surveys) and adjusted to the total (all modes) external productions and attractions[1] [1] The traffic counts were assumed to be more accurate Emme2 Conference: 10-11 Spetember 2004
TRIP DISTRIBUTION FACTORS • Two trip distribution functions were available from the previous model, one for the high income population group and one for the low income population group • Both were based on the private vehicle travel time matrices • In the re-calibrated Emme/2 transport demand model weighted trip distribution matrices (per income group) were introduced (iterative process) Emme2 Conference: 10-11 Spetember 2004
TRIP DISTRIBUTION AND MODAL SPLIT DILEMMA: • On the external side, the mode of transport is known but not the income group • On the internal side, the income group is known but not the mode of transport • Trip distribution matrices are available per income group as well as per mode of transport, but no single combined trip distribution matrix for the different modes of transport and population groups is available Emme2 Conference: 10-11 Spetember 2004
To simplify the problem on the external trips, • It was assumed that the high income group will rely 100% on car and the low income group 100% on public transport. The standard trip distribution technique could then be applied to the high income /car user group The problem however remains to resolve the low income / public transport trips. The aim was to develop a technique to combine the external trip data in such a manner that: • you have only one production, one attraction and one distribution matrix, but • still have a way to differentiate between the modes of transport in the data • The standard trip distribution technique could then be applied to resolve the problem Emme2 Conference: 10-11 Spetember 2004
The following process was adopted: • Step 1: Prepare two data files defining the zonal groups (ensembles) for the different transport modes • The one set represents the actual traffic zone numbers and • the other one temporary zone numbers. Emme2 Conference: 10-11 Spetember 2004
Step 2: Batch out[1] the trip productions/ attractions and trip distribution factors according to the actual zone numbers and read them back according to the temporary zone numbers • Step 3: Combine the external trip productions/ attractions as well as trip distribution matrices • Step 4: Execute a standard 2-D trip distribution process • Step 5: Split the external trips into bus, train and taxi matrices [1] Aggregate the data on the external side of the trips ends but not on the internal side Emme2 Conference: 10-11 Spetember 2004
Step 6:Batch out each matrix in terms of the temporary zone numbers and read them back into their final positions (actual zone numbers) • Step 7: Divide the person trip matrices with the average vehicle occupancy rates (per mode and per external zone) to determine the external vehicular trip matrices • Step 8: Combine the internal and external trip matrices Emme2 Conference: 10-11 Spetember 2004
EVALUATION OF END RESULT • The total number of external trips equals the traffic counts (per mode) • Nothing has been allocated to origin-destinations that have not been connected for that particular mode and • the general trend of a gravity model applies • After trip assignment, the results were also analysed and were found to be quite realistic • Unfortunately insufficient data was available to prove that the technique statistically provides the correct distribution Emme2 Conference: 10-11 Spetember 2004
SUMMARY AND CONCLUSION The model proves that this relatively easy technique can be used with great success to manage the external trips where insufficient data exists. It is therefore recommended that this technique be considered and used in similar cases Emme2 Conference: 10-11 Spetember 2004