Download
1 / 19
200 likes | 501 Vues
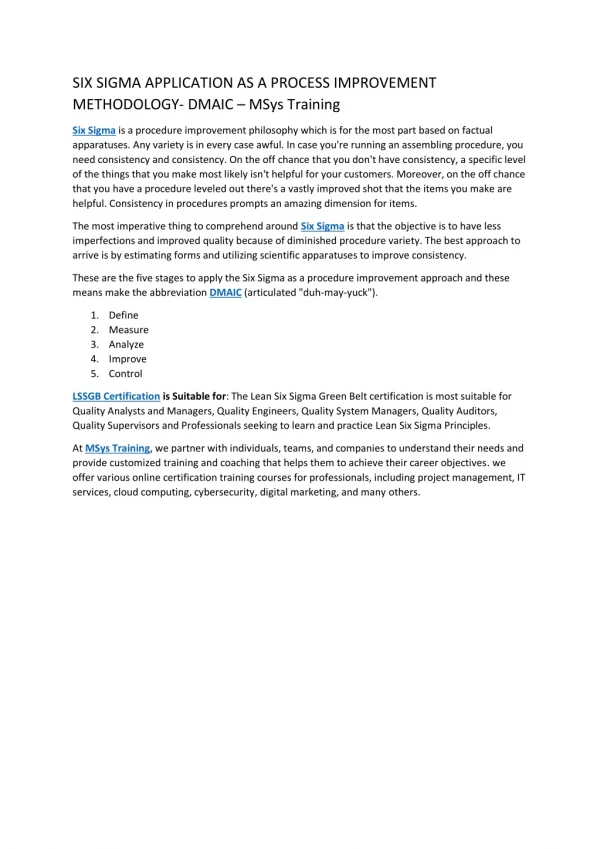
This case study explores the successful application of Lean Six Sigma methodology in reducing the TAT outliers in laboratory reports, enhancing patient care services, and increasing financial benefits. The project involved analyzing data, implementing improvement strategies, and achieving set objectives within a defined timeframe. The results show a significant decrease in TAT outliers and improved operational efficiency.

E N D
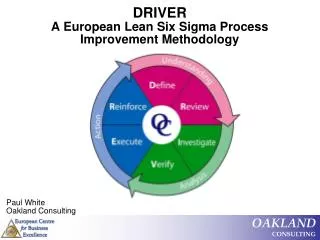
Improvement in the TAT of laboratory reports using six sigma methodology Dr Khalida Parveen Basha N Lean six sigma black belt NABL assessor Certified CAP team lead
DEFINE PHASE PROJECT NAME Improvement in the turn around time of laboratory reports In the FY 2014-2015 11% of the laboratory reports had TAT outliers(>240 mins) ) impacting patient clinical care. PROBLEM STATEMENT Reduce the TAT outlier to < 5 % GOAL STATEMENT • Patient care service/general duty assistant not under direct • control • No audit trail for transport time from collection to accession and from accession to the biochemistry department. • No audit trail for report dispatch • - HIS not user friendly CONSTRAINTS
Project objective Status at the start of the project (April 2015) • 9.1 % TAT outlier (defects) • Test load : 172 tests per day Status aimed at the end of the project (Nov 2015) • < 5% TAT outlier (defects) • To increase the number of tests per day by 36 tests • Increase in the financial benefit between Rs 3960 /day to Rs. 86,400/day
Scope: All biochemistry reports Out of bounds: • IP and outsourced tests • samples billed before 6AM and after 4PM • National holidays and Sundays • Timed samples • Urine and other fluid samples
SCHEDULE PRIMARY CUSTOMER Patient/Requesting doctors
MEASURE PHASE Turn around time from billing to report verification TYPE OF MEASURE • HIS biochemistry data of two weeks • Sample audit, time and motion study of two days (Gemba) DATA COLLECTION STRATEGY TAT more than target time i.e 4 hours (240 minutes) OUTLIER
PROCESS MAP Target time from billing to collection: 10 mins Billing of the tests Sample collection Phlebotomy Target time from collection to acknowledgment: 45 mins Sample transport Sample acknowledgement Accession Sample receipt Target time from acknowledgment to verification : 120 mins Result entry Biochemistry Department Result verification
Cause and effect diagram (Ishikawa) Report delay
Prioritisation of Xs: Control / Impact Matrix IMPACT MEDIUM LOW HIGH CONTROL IN OUR CONTROL OUT OF OUR CONTROL
HIS data ANALYSE PHASE Gemba-time and motion study Target time:10 mins Source:1. HIS 2.Gemba-time and motion study Data: Population Area: Phlebotomy
HIS data Gemba-time and motion study Target time: 45 mins Source:1. HIS 2.Gemba-time and motion study Data: Population Area: Accession
HIS data Gemba-time and motion study Target time: 120 mins Source:1. HIS 2.Gemba-time and motion study Data: Population Area: Biochemistry
Improvement strategy Phlebotomy: • Non value added steps reduced in the sample collection process • Takt time analysis done and staff allotted for sample collection during the peak time and back up provided for sample collection when there are more three patients waiting • Two dedicated GDA staff & their back up trained for sample transport and time management Accession: • GDA training for the transport of samples from accession to the biochemistry department • Specific time to be allotted for outsource report dispatch
Improvement strategy Biochemistry department: • Pending lists monitored at frequent intervals • The unresolved IT issues were compensated to some level by the technical staff suggestions in the brainstorming session: 1. Manual dilution programming for auto calculation (manual calculation step was skipped) 2. Manual assignment of the position and rack ID (helped in the reduction of number of steps in the manual process) Suggestions that were not implemented- • Two dedicated staff to be provided covering 7AM-5:30PM • Target time of the transport time to be revised to 10mins from 45mins as we have pneumatic chute system for sample transport
Project objective Status aimed at the end of the project • < 5% TAT outlier (defects) • To increase the number of tests per day by 36 tests • Increase in the financial benefit between Rs 3960 /day to Rs. 86,400/day Achievement at the end of the project • 4.6 % TAT outlier (defects) • Increased the number of tests per day by 76 tests • Financial benefit achieved between Rs 8360 /day to Rs. 1,82,400/day Target Achieved
CONTROL PHASE For the sustenance of the TAT • The pending tests list is monitored twice daily at 11 AM and 4 PM by the biochemistry department to control the TAT of the tests. • Monthly TAT review in the laboratory quality meeting and quarterly TAT review by the hospital quality department.
Conclusion Lean six sigma methodology has helped in the achievement of the following: • increasing productivity without any additional resources; • improving quality by reducing the opportunities for error; and • ensuring the improvements are maintained through systematic and timely monitoring. • The stakeholders have noticed the change and improvement in the turnaround time of biochemistry reports. • Staff feel appreciated and motivated as their suggestions has played a vital role in the success of this project. • Furthermore, this project has served as a model that launched other quality improvement programs in the hospital