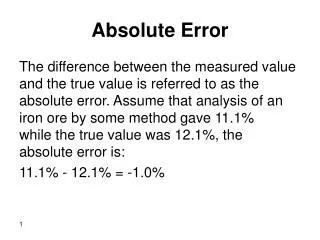
Absolute Error
Absolute Error. The difference between the measured value and the true value is referred to as the absolute error. Assume that analysis of an iron ore by some method gave 11.1% while the true value was 12.1%, the absolute error is: 11.1% - 12.1% = -1.0% . Relative Error.

Absolute Error
E N D
Presentation Transcript
Absolute Error The difference between the measured value and the true value is referred to as the absolute error. Assume that analysis of an iron ore by some method gave 11.1% while the true value was 12.1%, the absolute error is: 11.1% - 12.1% = -1.0%
Relative Error The relative error is the percentage of the absolute error to the true value. For the argument above we can calculate the relative error as: Relative error = (absolute error/true value)x100% = (-1.0/12.1)x100% = -8.3%
Relative Accuracy The percentage of the quotient of observed result to the true value is called relative accuracy. Relative accuracy = (observed value/true value)x100% For the abovementioned example: Relative accuracy = (11.1/12.1)x100% = 91.7%
Standard Deviation The standard deviation for a set of data provides information on the spread of the values.
What we mean by spread is clear from the graphs blue and red. Values used to draw red graph are not as close to each others as values in the blue graph. Therefore, values in the red graph have higher spread from the mean and have higher standard deviation. On the contrary, values in blue graph are close together and have a lower spread from their mean, and thus have a lower standard deviation.
For an infinite or large number of data points (more than 20) or when the true mean is known, the population standard deviation is defined as: s = ( S (xi - m)2 / N )1/2 Where s is the population standard deviation, m is the population mean, xi is the individual data point, and N is the number of data points
However, in real chemical laboratories where a sample is analyzed, an experiment is repeated three to five times and thus a very limited data points (3-5) is collected. The sample standard deviation (s) is defined as: s = ( S (xi - x)2 / (N-1) )1/2 x is the average (mean) of the data points. The sample standard deviation is also called estimated standard deviation since it is only an estimate of s .
Example The following replicate weights were obtained for a sample: 29.8, 30.2, 28.6, and 29.7 mg. Calculate s, s(mean), RSD, and RSD(mean) Solution First, we find x X = (29.8+30.2+28.6+29.7)/4 = 29.6
xi xi – x (xi – x)2 29.8 0.2 0.04 30.2 0.6 0.36 28.6 1.0 1.00 29.7 0.1 0.01 S = 1.41 s = ( S (xi - x)2 / (N-1) )1/2
s = (1.41/3)1/2 s = 0.69 mg S(mean) = s / N1/2 S(mean) = 0.69/(4)1/2 S(mean) = 0.34 mg RSD or CV = (0.69/29.6)x100% = 2.3% RSD(mean) = (0.345/29.6)x100% = 1.1%
It should be recognized that as the number of experiments is increased, the precision of the measurement is increased as well. This means smaller s due to smaller spread. This is because s a 1/N1/2 which means that decrease in s as N increases is not linear which implicates that, after some number of experiments, further increase in the number of experiments will result in very little decrease in s (try it on your calculator), which does not justify extra time and effort.
Pooled Standard Deviation (sp) When the same experiments are done using two different methods, the standard deviation can be pooled in order to determine the reliability of the analysis method (proposed or new). Sp = {S (xi1 – x1)2 + S(xi2 – x2)2)/(N1 + N2 –2)}1/2 Sp is the pooled standard deviation, x1, x2 are average values for data set 1 and 2, respectively, N1, N2 are the number of data points of data set 1 and 2, respectively
Example Mercury in a sample was determined using a standard method and a new suggested method. five replicate experiments were conducted using the two procedures giving the following results in ppm New MethodStandard method 10.5 10.1 9.9 10.3 10.4 10.2 11.2 10.3 10.5 10.4 Find the pooled standard deviation
First find x1 and x2 X1 = (10.5+9.9+10.4+11.2+10.5)/5 = 10.5 X2 = (10.1+10.3+10.2+10.3+10.4)/5 = 10.3 S(Xi1-X1)2 = { (10.5-10.5)2 + (9.9-10.5)2 +(10.4-10.5)2 + (11.2-10.5)2 + (10.5-10.5)2} S(Xi1-X1)2 = 0.86 S(Xi2-X2)2 = { (10.1-10.3)2 + (10.3-10.3)2 + (10.2-10.3)2 + (10.3-10.3)2 +(10.4-10.3)2} S(Xi2-X2)2 = 0.06 Sp = {(S(Xi1-X1)2 + S(Xi2-X2)2)/ (N1 + N2 –2)}1/2 SP = {(0.86+0.06)/(5+5-2)}1/2 = 0.34