Download
1 / 1
10 likes | 100 Vues
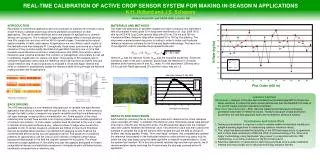
Study on comparing N application rates using high-N reference and virtual reference strips, evaluating "Drive and Apply" method for variable-rate N applications, and feasibility of optical sensor technology calibration for reducing technology adoption barriers.

E N D
k = 1.0 Begin Material Application k = 0.25 k = 0.87 k = 0.75 k = 0.50 k = 1.0 Scan Crop REAL-TIME Calibration of Active Crop Sensor SYSTEM for Making In-Season N Applications K.H. Holland and J.S. Schepers Holland Scientific and USDA-ARS, Lincoln, NE Materials and Methods Two eight-row wide strips of sprinkler-irrigated corn each containing four replications with six pre-plant N rates (plots 15-m long) were monitored on 21 July, 2009 (V12) with two ACS-470 Crop Circle sensors fitted with 670 nm, 730 nm and 760 nm interference filters. Adjacent strips either received 50 or 150 kg N at planting. The strips were scanned several days prior to testing in order to obtain and hardcode reference values into software for the Drive-and-Apply methodology. The basic form of the algorithm used to calculate the proposed N rate was: where NOPT was the optimum N rate, NCRD was the N applied at planting, SI was the sufficiency index of the plot in question, and ΔSI was the difference in SI values between plots receiving zero N and NOPT rates. For this experiment, ΔSIwas set to 0.3 for use with Red-Edge based SI’s and the k factor was set 1.0. Introduction Reluctance of commercial applicators and corn producers to endorse the concept of using a high-N strip to calibrate active crop sensors prompted consideration of other approaches. The use of starter fertilizers and some preplant N applications is common among corn producers. The in-season N application strategy relies on enough planting-time N to supply the corn crop until the V8-V14 growth stages. Considering the natural spatial variability in fields, early season N applications are very likely to result in parts of the field with more than adequate N. Conceptually, these areas could serve as a high-N reference if they could be readily identified and quantified. Scanning one or more field transects would therefore constitute a virtual reference strip (VRS) from which a sensor reference value could be extracted. The inclusion of management zone scalars (k) can aid in optimizing N application for various soil types. The purpose of this research was to compare N application rates using the reference values derived from an high-N strip and virtual reference strip. A second goal was to evaluate a “Drive and Apply” method that relies on software to progressively update the reference while driving through the field and making variable rate N applications. 252 kg N/ha Preplant (Reference) 84 kg N/ha Preplant 0 kg N/ha Preplant (Check) Sensed transect • Lessons Learned • Wavebands – Analysis of the data demonstrated that the Red-Edge/NIRChl Index had better sensitivity to respond to plant nutrient deficiencies than the Red/NIRChl Index at the growth stages and plant populations sampled. • Reference Value Selection – Both real-time statistical and histogram techniques generated reasonable VI reference values. However, because of data distribution asymmetry, the real-time approach had to be corrected for skew and kurtosis. • Conclusions and Future Work • Testing and evaluation is ongoing in order to validate additional statistical models and adaptive learning algorithms for determining optimum reference values. • This study has demonstrated the feasibility of the VRS technique and is in agreement with on-farm tests conducted in 2008 and 2009. Continued testing of the “Drive-and-Apply” methodology, using hardcoded “plug values” in conjunction with the VRS methodology, is currently underway for the 2010 field season. • Real-time calibration of optical sensor technology promises to be a useful calibration method and may possibly aid in reducing technology adoption barriers. High N reference strip comparison to moderate and zero preplant N rates. VRS Field Transects VRS Field Transects using Management Zone Factors Background The VRS methodology is a non-reference strip approach to variable-rate agrochemical application that utilizes a random walk through the field, or rather, one or more transects through the field in order to measure crop growth variability resulting from differences in soil type, drainage, cropping history, mineralization, etc. Some aspects of the virtual reference strip concept have evolved from cropping systems where multiple applications of nutrients are common. In some cases, nutrients must be rationed to the crop in order to maintain strong plant architecture (e.g., wheat is known to lodge when excess N is available in soil). In certain situations, producers are limited on how much N fertilizer that can be applied before planting or prohibited from applying excess N above the recommended amount during any one application period. This spectrum of conditions presents an opportunity to use the crop as a bio-indicator of relative nutrient status because multiple places in the field the crop will represent N-rich plants. The virtual reference concept capitalizes on this reality and uses the capacity and speed of modern computational devices and statistical procedures to characterize plant attributes that are traditionally extracted from a reference strip. Test Site Shelton, NE Results and Discussion Each field strip containing the six N-rates was scanned to determine the virtual reference value (red-edge chl index) to establish the reference value. Reference values were derived from scans of the 50 and 150 kg N/ha strips. The 95 percentile values from the collected data were used to establish the reference value. This reference value was then used by the software to calculate the SI as the sensors then traveled through the field as though N fertilizer was being applied. Finally, “Drive-and-Apply” software, that comparatively updated the reference value based on the hardcoded reference value and the crop status thus-far within the strip, was tested using the same algorithm to make N recommendations. Once the system had traveled ~90 m and encountered relatively high and low vigor plants, the N recommendation nearly mimicked the N rates where the strip was scanned before N application. Irrigated