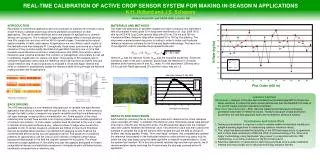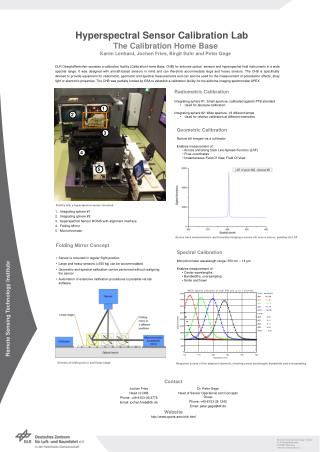
Innovative Calibration Techniques for Active Crop Sensors Using Virtual Reference Concept
This paper explores advanced calibration methods for active crop sensors, focusing on the Virtual Reference concept proposed by K.H. Holland and J.S. Schepers. It analyzes various calibration techniques, including N-Rich reference strips, postage-stamp calibration, and randomized calibration blocks. The study emphasizes the importance of minimizing soil variability in treatment blocks and adapting algorithms based on crop nitrogen response. Furthermore, the authors discuss the need for simple, versatile algorithms that aid commercial growers. Practical recommendations are provided for effective nitrogen management in-season.

Innovative Calibration Techniques for Active Crop Sensors Using Virtual Reference Concept
E N D
Presentation Transcript
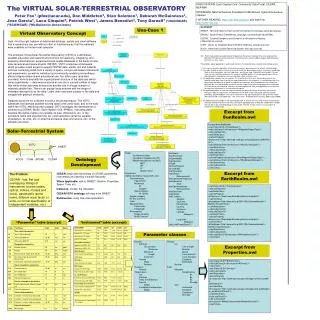
Active-Crop Sensor Calibration Using the Virtual-Reference Concept K. H. Holland (Holland Scientific) J. S. Schepers(USDA-ARS, retired) 8th ECPA Conference 2011
N-rich other N rates check “N-Rich”Reference • Postage-stamp calibration • Ramped calibration strip • Randomized calibration block (field strips)
Modified Postage Stamp check • Combine-width plots • Randomized except check plot • Each block of treatments should have minimal soil variability • Repeated replications
check N-Rich Modified Calibration Ramp • Standard ramp of plots • No randomization • Each N rate in the ramp has a nearby check and adequate N reference • Could randomize N rates in the ramp strip
Commercial applicators and large producers - - TELL US : • N-rich strips are problematic • May be hard to locate (legal problems) • Need to move each year • Can not expect operators to understand how the algorithm and sensor calibration work • Need a “turn-key” approach that does not require N-rich strip or highly-skilled operator • Algorithm needs to be simple, versatile, and easy to adapt for local conditions
Algorithms • based on predicted yield potential (Oklahoma State University) (GreenSeeker) 2) based on producer-set minimumandmaximumN rates (Europe & Missouri) 3) based on extension of crop N-response function (Holland and Schepers) Note:All algorithms use sensor data that are normalized to “healthy crops” .
In-Season N Management Crop vigor during the growing season is proportional to yield at harvest
How to Characterize Healthy Crops ? • N-Rich Strip (or Ramp Calibration Strip) average(as with plot studies) programmed (highest 3 consecutive seconds) • Normal Field Transects identify healthy plants from frequency distribution of all plants (histogram) (MS Excel)
Mexico -White Corn, 2010 Crop Circle 600 m @ ~6 kmph
95 Percentile 3% lower Mexico -White Corn, 2010 Crop Circle 600 m @ ~6 kmph 3-second Running Average = 5.057 95 Percentile = 5.206
SI = = 0.85 4.47 5.21
N Credits Preplant N Field Reference EONR Producer Optimum Sufficiency Index Back-Off Strategy SI to start cutback SI to cut-off N Accumulation (based on growth stage) Spatial Soil / Topography Adjustment Algorithm
√ (1 – SI) ∆SI Farmer Rate or NEONR S e e Holland K.H. and J.S. Schepers. 2010. Derivation of a variable rate nitrogen application model for in-season fertilization of corn. Agronomy Journal 102:1415-1424. √ Nappl =( Nopt – Ncred )
OptRx Soybean Previous Year Check Plot
5% lower GreenSeeker CIred-edge values : 95 percentile 1.985 3-second average 1.889
Irrigated Corn - 2009 V9 Growth Stage 95 percentile
Drive and Apply Mexico, 2010
There’s Probably a Lot More Information in a Histogram than We Realize ! • Where’s it at ? • How to get it out ?
Mexico 2010 - Irrigated Corn V5 Growth Stage SI = 0.7
Mexico -White Corn, 2010 Crop Circle 600 m @ ~6 kmph 95% Cut-back level
Conclusions • The virtual reference concept offers producers a convenient approach to quantify the vigor and chlorophyll status of crops for in-season N applications. • Histograms of active sensor data and related analyses offer a quick glimpse of where to focus management efforts. New sensors and tools will be needed to help fine tune management decisions.
Thank You Jim Schepers 402-310-6150 james.schepers@gmail.com
Historic Perspective • N-Rich treatment was initially used to normalize data from plot studies and allow leaf N concentration comparisons across time, fields, cultivars, etc. (1988) • Extended to normalization concept to SPAD meters. (1990) • Adapted to field situations and N-Rich strips to accommodate crop canopy sensors. (~2000)
Historic Perspective • N-Rich plot concept extended to postage stamp arrangement with multiple N rates. (2002) • Ramped calibration strip with multiple N rates introduced. (2005) • Need for active sensor calibration technique to accommodate commercial applications. (2007)