Tracking brain dynamics via time-dependent network analysis
This study introduces a novel methodology for analyzing brain dynamics through time-dependent network measures derived from multi-channel EEG recordings. We employed a frequency-dependent sliding time window and Dijkstra's algorithm to develop adjacency matrices reflecting brain activity. Our results demonstrate that mathematical thinking activates specific cortical networks, influencing language function and memory processes. We highlight the brain's 'small-world' topology and emphasize how traditional static methods may overlook significant dynamic changes in connectivity. This approach enhances our understanding of brain function during complex cognitive tasks.

Tracking brain dynamics via time-dependent network analysis
E N D
Presentation Transcript
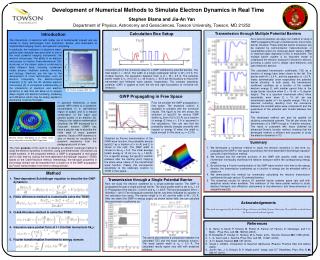
Tracking brain dynamics via time-dependent network analysis Stavros I. Dimitriadis,Nikolaos A. Laskaris, Vasso Tsirka, Michael Vourkas, Sifis Micheloyannis, Spiros Fotopoulos Electronics Laboratory, Department of Physics, University of Patras, Patras 26500, Greece Artificial Intelligence & Information Analysis Laboratory, Department of Informatics, Aristotle University, Thessaloniki, Greece Medical Division (Laboratory L.Widιn), University of Crete, 71409 Iraklion/Crete, Greece Technical High School of Crete, Estavromenos, Iraklion, Crete, Greece http://users.auth.gr/~stdimitr
Outline Introduction -Multichannels EEG recordings -math calculations (comparison and multiplication) -multi frequency band analysis (from theta to gamma) • Methodology • - a frequency-dependent time window • - a novel, parameter-free method was introduced to derive the required adjacency matrices (Dijkstra algorithm) • a summarizing procedure that was based on replicator dynamics and applied in consecutive adjacency matrices was introduced where consistent hubs were identified
Outline Results Conclusions
Mathematical thinking, as a cognitive process, activates local and spatially distributed cortical networks Exact calculationsare correlated with language function activating language specificregions located in the left hemisphere Duringmental calculations different processes are necessary, such as the -recognition of the numbers in their Arabic form, -the comprehensionof verbal representation of numbers, -the assignment of magnitudesto numerical quantities, -attention, memory, and other morespecialized processes During difficultmathcalculations, additional cortical regions, particularly of the lefthemisphere, show increased activation. These calculations demandretrieval of simple mathematical fact
Motivation to introduce a methodology for tracking brain dynamics via network measures derived from time-evolving graphs to experimentally compare the obtained description – i.e., the network-metric time series (NMTS) – against the description from a single static graph or from a few successive snapshots of functional connectivity to detect consistent hubs based on a summarization procedure called replicator dynamics To introduce a novel parameter –free threshold scheme based on Dijkstra’s algorithm
Outline of our methodology We introduced the concept of time-dependent network analysis based on weighted graphs constructed from EEG-signals using the Phase Locking Index (PLI) and metrics reflecting functional segregation (clustering coefficient and local efficiency) and integration (characteristic path length and global efficiency). The key idea was the employment of a sliding, frequency-dependent time-window, and its application has shown that the network metrics (i.e., the resulting time-series (NMTS)) were subject to modulations following the characteristic oscillations of each frequency band Interestingly, brain dynamics evolved under the constraintsof a ‘small-world’-topology that was ever-changing but consistentwith the demands of local processing and global integration. Suchtrends are lost by approaches in which network characterizationis attempted through static topologies or using signal segments ofarbitrary length
Evaluation of our methodology: -our frequency dependent time window was compared with a static and fixed time window (100 ms) without overlapping in terms of the small – world index γ values across subjects and for each frequency band which was estimated for 2 pairs of networks metrics -our parameter free algorithm for the detection of significant edges was compared with 3 highly used threshold schemes in terms of the quality of the fit of the degree distribution to well-known forms of distribution (here power-law) -Replicator dynamics showed consistent hubs in areas related to brain rhythms and tasks.
Data acquisition: Math Experiment 18 subjects 30 EEG electrodes Horizontal and Vertical EOG Trial duration: 3 x 8 seconds Single trial analysis 3 Conditions: Control Comparison Multiplication The recording was terminated when at least an EEG-trace without visible artifacts had been recorded for each condition
Filtering Using a zero-phase band-pass filter (3rd order Butterworth filter), signals were extracted for six different narrow bands :θ(4–8 Hz), α1 (8–10 Hz),α2(10–13 Hz), β1 (13–20 Hz), β2 (20–30 Hz) and γ(30–45 Hz). Artifact Correction artifact reduction was performed using ICA employing runica EEGLAB (Delorme & Makeig,2004), -Components related to eye movementwere identified based on their scalp topography which includedfrontal sites and their temporal course which followed the EOGsignals. -Components reflecting cardiac activity were recognized from the regular rythmic pattern in their time course widespread in the corresponding ICA component.
Signal Power (SP) Calculation of SP for each recording site The SP values corresponding to each single electrode were contrasted for every subband and additionally the whole delta-band. Significant changes were captured via one-tailed paired t-tests (p < 0.001). Τhe functional connectivity graph (FCG) describes coordinated brain activity In order to setup the FCG, we have to establish connections between the nodes (i.e. the 30 EEG electrodes). Phase synchronization, is a mode of neural synchronization, that can be easily quantifiedthrough EEG signals
Phase-locking Value (PLV) PLV quantifies the frequency-specific synchronization between two neuroelectric signals (Mormann et al., 2000 ; Lachaux et. al. 1999). We obtain the phase of each signal using the Hilbert transform. (t, n)is the phase difference φ1(t, n) - φ2(t, n)between the signals. PLV measures the inter-trial variability of this phase difference at t. If the phase difference varies little across the trials, PLV is close to 1; otherwise is close to 0
PLV procedure for a pair of electrodes Adopted from Lachaux et al,1999
Building the FCG Establishing links for a single electrode 0.9 0.6 The process is repeated for every electrode, creating a complete graph.
Surrogate Analysis -To detect significant connections, we utilized surrogate datato form a distribution of PLI values, for each electrode-pair separately,that corresponds to the case in which there is no functionalcoupling - Functional connections that showed significant differences, with respect to the distribution of PLI values generatedby a randomization procedure corresponding to each electrodepair,were only considered. -Since our analysis was based on a singlesweep, we shuffled the time series of the second electrode for eachpair (in contrast to the case of multiple trials where one shufflesthe trials of the second electrode as described in Lachaux et al., 2000).
5% Nonparametric Null Distribution Surrogate Analysis -Finally, theoriginal PLI values were compared against the emerged baselinedistribution (surrogate data) and this comparison was expressedvia a p-value which was set at p < 0.001. -Graph edges where theabove criterion was not met, were assigned a zero-weighted link. To reduce computational effort of the surrogate analysis one can employ FDR (false discovery rate)
Network Analysis The clustering coefficientC of network is defined as : in which ki is the degree of the current node The characteristic path lengthLis defined (through integration across all nodes) as:
Network Analysis The global efficiencyGE of network is defined as : in which ki is the degree of the current node The local efficiencyLEis defined (through integration across all nodes) as:
Small – World network measures -We rewired each network 1000 times using the algorithm proposed in (Maslov & Sneppen, 2002) -Derived Cr and Lr as the averages correspondingto the ensemble of randomized graphs. The two (normalized)ratios γ= C/Cr and λ= L/Lr were used in the summarizing measureof “small-worldness”, defined as σ= γ/λ, which becomes greaterthan 1 in the case of networks with small-world topology.The above commputations were based for both pairs of network metrics. -The above described computations were performed for each subject/frequecy band separately and for each of the 3 approaches: -static -frequency dependent overlapping windows -fixed windows without overlapping
General scheme Connections in biological neural networks might fluctuate over time therefore, surveillance can provide a more useful picture of brain dynamics than the standard approach that relies on a static graph to represent functional connectivity. Fixed time window vs frequency dependent (Cycle Criterion)
Unfolding the non-stationarity of brain EEG dynamics via the frequency dependent analysis Interestingly, the resulting NMTS (network metrics time series) appeared to follow thecharacteristic oscillations of each frequency band.
Threshold schemes The selection of a threshold is not trivial Various threshold schemes were proposed: • mean degree K • absolute threshold • keep a % of strongest connections • take the value that maximize the global cost efficiency (gce=global efficiency - cost) versus cost (the ratio of existing (anatomical connections ) or surviving edges (after applying a threshold) divided by the total number of possible connections )
Dijkstra’s algorithm Construct the FCG (functional connectivity graph) Construct distance matrix by inversing each entry of the FCG Why ? For instance, in a weighted correlation network, higher correlations are more naturally interpreted as shorter distances, and the input matrix should consequently be some inverse of the connectivity matrix. Finally, we draw shortest path lengths in an adjacency matrix
Replication dynamics Despite the rapidly growing number of data-analysis techniques in functional imaging, the field lacks formal mathematical tools for the aggregation of the results from single-subject data to group data or from single-sweep analysis to ensembles. For the particular purpose of identifying commonalities in the hubs defined across individual subjects, the most popular approach consists of plotting hub regions from each subject into a single figure and recognizing the overall average trend. The above technique relies on visual inspection. Solution ?? Replicator dynamicswhich helps toidentify hubs appearing consistently within and across subjects
Replication dynamics -Applying Dijkstra’a algorithm to each time instant FCG -Summarizing in a co-occurrence matrix the number of times that two regions appeared simultaneously as hubs in the adjacency matrix. A node is characterized as hub if its degree overcome the value = mean + 1 std of the overall graph. This procedure was followed firstly at each subject and in a second step across subjects.
Small - Worldness For the staticand time-varying approaches to be comparable, the mean of thevalues obtained across time was estimated in the latter cases. Significant differences (p < 0.001) weredetected for S via one-tailed paired-t tests (applied across subjects)comparing our approach against the piecewise approach (i.e., t2versus t1) and the approach based on static graphs (i.e., t2 versus s).
NMTS Functional snapshots incorporate a time-varying structure that can be attributed to therelated cognitive task (comparison or multiplication) because thevalues of the related network metric are significantly higher thanthe control condition. The obtained time-dependent measurements seem toprovide us with a more reliable characterization of the networktopology, which is closer to a small-world network when theemployed topological descriptor has not collapsed the time-relatedvariations.
Broadband scale-free character of math calculations across subjects Our approach based on Dijksta’s algorithm resulted insystematicallyhigher R2-values (is a statistical measure that shows how well the regression curve represents the actual measurements) Our approach and max(cost efficiency) are the only threshold scheme that quarantee the connectness of the nodes.
Broadband scale-free character of math calculations across subjects No difference was observed between the 2 math tasks
Scalp distribution of hubs Τhe θ-band hubs are located within the frontal region that is related to working memory the a2-band hubs arelocated bilaterally over the parieto-occipital regions and, presumably, can be attributed to visual attention
Conclusions Our methodology included the following elements: -afrequency-dependent definition of a time-window, -a phase-lockingestimator for the pair-wise assessment of functional connectivity from signal segments, -the computation of standard network metricsfrom the time-varying graphs, and -a novel method to reveal themost significant edges in a given network to construct the requiredadjacency matrices without a threshold selection step. -Moreover,the individual time-dependent adjacency matrices were utilized in a new aggregation scheme (replicator dynamics) that identified keynote nodes (brainregions) for the observed connectivity patterns across subjects (i.e.,group analysis).
Future research The incorporation of empirical techniques for the tracking and extraction of time-varying oscillations (Fine et al., 2010), such as Empirical Mode Decomposition The incorporation of connectivity estimators that can take into consideration the complexity and the non-stationary/non-linear character of brain signals are among the necessary improvements that should be pursued in the future. and the replacement of the oversimplifying notion of pair-wise interactions with the combinatorial n-way synchrony (Jung et al., 2010), will enrich our knowledge of actual brain dynamics