Tsunami Recovery Program Data Quality Assessment
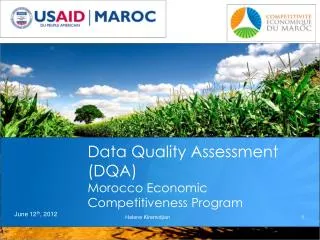
This report summarizes the findings from a data quality assessment (DQA) conducted on the American Red Cross Tsunami Recovery Program (TRP) across four countries: Thailand, Sri Lanka, Maldives, and India. Utilizing standardized WHO auditing procedures, the DQA evaluated seven projects to ensure accurate and reliable information. The results revealed varied performances, with some projects exceeding quality standards while others, particularly in Sri Lanka, required strengthening. Recommendations have been provided to improve the data quality assurance processes within the program.

Tsunami Recovery Program Data Quality Assessment
E N D
Presentation Transcript
Tsunami Recovery ProgramData Quality Assessment American Red Cross Tsunami Recovery Program Regional Technical Team, Bangkok 15 September 2009
Overview • Summarize findings from a data quality assessment completed in 4 of 5 TRP countries, including south Thailand, Sri Lanka, the Maldives and India • Data quality assessment (DQA) was completed using the standardized WHO auditing procedure to ensure reports were accurate and consistent for selected data elements
Purpose • A Data Quality Assessment was conducted to ensure credible, reliable, and verifiable information as a foundation for American Red Cross Tsunami Recovery Program Accountability Framework Reports
Extent of the Data Exploration • TRP Data Quality Assessment presents the results following the in-depth review of 7 TRP projects: • four projects in Thailand (WatSAn, CBH, FAY, DP) • one project in Sri Lanka (DP) • one project in Maldives (WatSan) • one projects in India (TNIRP)
5 Basic Steps • Review available source documents to verify written documentation to • Recount & recalculate reported results • Cross-check reported results with other data sources (such as budget summaries) • Match project indicators routinely monitored with reporting requirements • Review reporting forms, data-collection procedures, and clarity of indicator definitions
DQA Dimensions • Availability and accessibly of indicator source documents period • Completeness of all indicator sources • Accuracy reported results when compared to recounted information • Successful verification by cross-check reported results with other data sources • Use of standardized data-collection forms • Presence of routine data quality control
Results • Data quality assessment results from our TRP Sri Lanka and the Maldives projects were mixed • Results of the DQA indicated that the Maldives Water and Sanitation projects adequately, exceeding the minimum 80% standard set for data quality • The very complex Sri Lanka Disaster Preparedness project requires strengthening and standardization within the reporting system, with an overall score of <80% for the DQA
Results • Data quality assessment results from our TRP Thailand and India projects were stronger. • Thailand Water and Sanitation, Community-based Health, and Youth First Aid achieved an 80% DQA performance score, when not considering the ‘hygiene promotion’ component • In India, the TRP team implemented a computerized Management Information System (MIS) which facilitated routine data quality assurance and overall DQA score of >80%
Strengths • Implementation of uniform TRP monitoring and evaluation indicators, using the Logical Framework Approach (LogFrame), allowed project progress to be monitored globally. • Country Offices having designated, full-time M&E Managers, illustrating the commitment of ARC to the creation of a strong monitoring system throughout TRP.
Strengths • Quarterly Project Report and Accountability Framework indicators have clear written documentation. • M&E Managers in two of the three countries included in the DQA developed M&E Frameworks and monitoring plans based on the LogFrame. • However, the M&E Plans were not fully implemented in any of the TRP Countries
Weaknesses • Weaknesses identified during the DQA confirmed the need for the establishment of routine data quality assurance. • Currently, data quality is cross-checked only when monthly or quarterly reports are compiled. • The absence of routine data quality assurance dramatically increases the time and effort required to confirm and document QPR and AF indicators.
Weaknesses • In overview, the extensive Quarterly Project Report or Accountability Framework reporting requirements commonly overburden field teams and are not relevant to project management indicators. • There is discontinuity between routine monitoring systems focusing on project management with the “top down” national headquarters reporting requirements.
Conclusion • Overall, the TRP monitoring systems were found to be performing sub-optimally, based on World Health Organization-recommended DQA. • TRP Monitoring and Evaluation teams are currently reviewing ways to fully implement standard operating procedures for routine data quality assurance.
Conclusion • In Thailand, decisions for quality improvement were linked to increasing the frequency of provincial field visits by M&E Officers and use of standardized electronic tracking sheets • In Sri Lanka, the M&E Manager initiated a branch by branch refreshed M&E training for the SL Red Cross Disaster Preparedness teams to strengthen standardized monthly reporting
Recommendations • Recommendations shared with TRP Country field teams related to three areas for enhance data quality, including: • QI through QA • Simple Technology Solutions • Reduce Number Reporting Elements
Create • Strengthen linkages between data essential for project management monitoring with required reporting indicators • QI through QA • Implement motivational strategy to encourage full implementation of quality improvement (QI) that establishes standard operating procedures for data quality assurance (QA) procedures.
Improvise • Simple Technology Solutions • Keeping data tracking systems simple is a basic tenet. M&E Managers have been asked to streamline routine monitoring & data collection by consolidating electronic tracking sheets into just two basic types of ‘multi-purpose,’ Excel worksheets (or Excel databases). • Excel files can have formulas and macros integrated to tabulate monthly totals, keep running totals & automatically calculate quarterly summary information
Simplify • Reduce Number Reporting Elements • Initiate discussions about the “bare bones” indicator list essential for project monitoring • Streamline monthly and quarterly information flow • The sheer volume of information collected creates a huge burden to field staff, such as the QPRs. • Reduce the number of routinely collected indicators retaining ONLY essential indicators.
References • The DQA tool is available from the World Health Organization • WHO. (2008). Assessing the National Health Information System, An Assessment Tool. Routine Health Information Network (RHINO) Technical Advisory Group. ISBN 978 92 4 154751 2. http://www.who.int/healthmetrics/tools/hisassessment/en/index.html • WHO. (2008). Data Quality Assessment, Version 4.0. Health Metrics Network Framework and Standards for Country Health Information Systems, World Health Organization, January 2008. http://www.who.int/healthmetrics/tools/Version_4.00_Assessment_Tool.pdf