Download

1 / 34
340 likes | 480 Vues
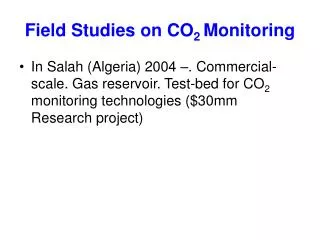
Analyzing pressure responses to Earth tides for monitoring CO 2 migration. Kozo Sato Geosystem Engineering The University of Tokyo. Objective. Monitoring techs for geological sequestration seismic (4D, VSP, cross-well tomography) non-seismic (electromagnetic, gravity, tilting, logging)

E N D
Analyzing pressure responses to Earth tides for monitoring CO2 migration Kozo Sato Geosystem Engineering The University of Tokyo
Objective • Monitoring techs for geological sequestration • seismic (4D, VSP, cross-well tomography) • non-seismic (electromagnetic, gravity, tilting, logging) • Alternative technique? • cost-effective • labor-saving • Utilize pressure responses to Earth tides • perturbation by the M and the S (no artificial energy required) • pressure measurements only (no extra operation required)
Outline • Objective • Tidal deformations • Earth tide • Cubic dilatation • Calculation of Cubic dilatation • Poroelasticity • Tidal signals in pressure responses • Results and discussion • Concluding remarks
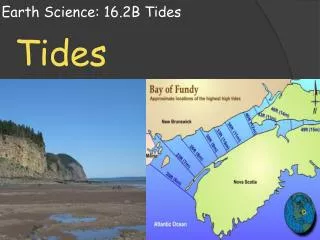
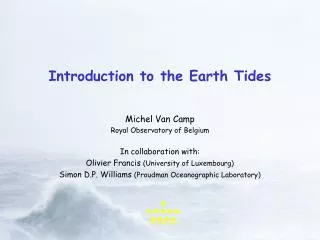
Tidal deformations • Earth tide • Tidal deformation (cyclic compaction and expansion) of the solid Earth • phenomenon similar to ocean tides • the gravitational attraction of the solar system bodies: M and S
Tidal deformations • Cubic dilatation • cubic dilatation (trace of strain matrix) • normal stresses and strains • near the Earth surfacefree surface boundary condition
Tidal deformations • Calculation of cubic dilatation • e as a linear combination of Y and its derivatives w.r.t. q • Y: spherical harmonics defining tidal potential • sample calculation of Q (an onshore site, Nagaoka, Japan)(latitude: 37.40, longitude: 138.70)
Outline • Objective • Tidal deformations • Poroelasticity • Deformations and pressure fluctuation • c and CO2 migration • Tidal signals in pressure responses • Results and discussion • Concluding remarks
Poroelasticity • Deformations and pressure fluctuation • tidal deformation induces pressure fluctuation Dp • Biot-Gassmann equation • poroelastic parameter c
Poroelasticity • c and CO2 migration • Kf for the H2O-CO2 system • c as a function of SCO2
Poroelasticity • c and CO2 migration • Kf for the H2O-CO2 system • c as a function of SCO2 • KCO2=0.003~0.07GPa, Kw=2.4GPa @1000m • c increases as SCO2 increases: c=ASCO2+B • c=-Q/Dp : a good indicator for monitoring the CO2 migration
Outline • Objective • Tidal deformations • Poroelasticity • Tidal signals in pressure responses • Pressure responses • Retrieving Dp(t) from p(t) • Results and discussion • Concluding remarks
Tidal signals in pressure responses • Pressure responses • long-term pressure trend pt(t) associated with a certain event, s.a. CO2 sequestration
Tidal signals in pressure responses • Pressure responses • long-term pressure trend pt(t) associated with a certain event, s.a. CO2 sequestration • total pressure response p(t) : superposition of pt(t) and Dp(t) • Dp(t): tidal signal induced by the Earth tide
Tidal signals in pressure responses • Retrieving Dp(t) from p(t) • model the long-term pressure trend with the cubic spline • retrieve the tidal signals p(t) pt(t)
Tidal signals in pressure responses • Retrieving Dp(t) from p(t) • model the long-term pressure trend with the cubic spline • retrieve the tidal signals p(t) pt(t) Dp(t)
Outline • Objective • Tidal deformations • Poroelasticity • Tidal signals in pressure responses • Results and discussion • Monitoring at a sequestration test field • Estimation of c • Detection of CO2 arrival • Concluding remarks
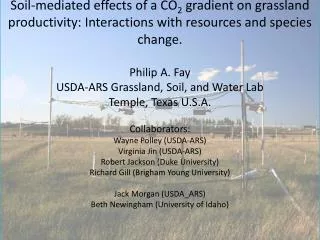
Results and discussion • Monitoring at a sequestration test field • onshore aquifer, Nagaoka, Japan • sandston bed, thickness: 60m, depth: 1100m • injection well: CO2-1, Zone-2a (6m) and Zone-2b (6m) • monitoring wells: CO2-2, CO2-3, CO2-4 CO2-4 logging pressure measurements 60m CO2-2 40m logging 120m CO2-1 CO2-3 logging
Results and discussion • Monitoring at a sequestration test field • pressure measurement • time-lapse sonic logging (compressional wave velocity)
Results and discussion • Monitoring at a sequestration test field • is it possible to detect CO2 arrival only with pressure data? • c=ASCO2+B
Results and discussion • Estimation of c (132-139 days) • calculation of Q
Results and discussion • Estimation of c (132-139 days) • Dp retrieved from the pressure data
Results and discussion • Estimation of c (132-139 days) • c=-Q/Dp • Q scaled to match the Dp profile
Results and discussion • Estimation of c (132-139 days) • c=-Q/Dp • Q scaled to match the Dp profile
Results and discussion • Estimation of c (387-394 days) • calculation of Q
Results and discussion • Estimation of c (387-394 days) • Dp retrieved from the pressure data
Results and discussion • Estimation of c (387-394 days) • c=-Q/Dp • Q scaled to match the Dp profile
Results and discussion • Estimation of c (387-394 days) • c=-Q/Dp • Q scaled to match the Dp profile
Results and discussion • Detection of CO2 arrival
Results and discussion • Detection of CO2 arrival • time-lapse c estimation (13 intervals)
Results and discussion • Detection of CO2 arrival • time-lapse c estimation (13 intervals) • c=ASCO2+B
Results and discussion • Detection of CO2 arrival • time-lapse c estimation (13 intervals) • c=ASCO2+B
Results and discussion • Detection of CO2 arrival • time-lapse c estimation (13 intervals) • c=ASCO2+B
Outline • Objective • Tidal deformations • Poroelasticity • Tidal signals in pressure responses • Results and discussion • Concluding remarks
Concluding remarks • The poroelastic parameter c, a function of SCO2, can be estimated from Dp and Q. • The CO2 migration can be monitored with time-lapse estimations of c. • The technique is applicable to well-developed sites (depleted o/g reservoirs).