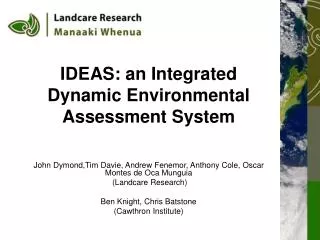
IDEAS Integrated Dynamic Environmental Assessment System
190 likes | 209 Vues
IDEAS is a tool and process designed to assist in learning about catchments. It utilizes the Evoland framework and data sources to evaluate models on fish abundance, floodplain habitat, land supply, population growth, and more. The system also includes Best Management Practices (BMPs) for present and intensive land use scenarios.

IDEAS Integrated Dynamic Environmental Assessment System
E N D
Presentation Transcript
IDEASIntegrated Dynamic Environmental Assessment System Goal: Helping learning about catchments A) Tool to help B) Process to use the tool
Evoland Framework Data Sources Evaluative Models Fish Abundance/Distributions Parcels (IDU’s) Floodplain Habitat Policy Set(s) Small-Stream Macroinvertabrates Agent Descriptors Upslope Wildlife Habitat Autonomous Process Models Evoland Parcel Market Values Population Growth Agricultural Land Supply Urban Expansion Forest Land Supply Vegetative Succession Residential Land Supply Land Value Conservation Set-Asides
Natural – Present – Intensive land use scenarios + BMPS Now extended to include Best Management Practices A) BMP for present scenario B) BMP for intensive scenario
ABEL TASMAN Economically and socially important areas AMA Sediment analysis Sediment modelling & spatial extent of Motueka River sediment influence A proxy for other conservative particles. eg. E. coli
Analysis of Data • Clear relationship of observed surface chlorophyll concentration to estimated monthly Nitrogen load seen in data (r2~0.5).
Nitrogen Load 234,932 kg/yr Historical 521,353 kg/yr Present 3,806,154 kg/yr Intensive Modelling results Models show increased riverine nutrients stimulate algal production in the surface waters during summer months. Depth Time (1 year)
Predicted future ecological carrying capacity. Current ecological carrying capacity. Social Impact Example Aquaculture production Application to future nutrient scenarios allows prediction of primary production available to filter-feeding aquaculture. Good News?
Production Modelling Maybe, but …. Mussel Farm production models do not show associated large increases in production due to overloading and sediment impacts. 23,000 -> 26,000 Tons for existing AMAs1 … although wider ecosystem may benefit from extra “food”. 1. Output from farm-scale model, www.farmscale.org
Demonstrating the Potential:The Effects of Nitrogen on Mussel Production in Tasman Bay
Natural – Present – Intensive land use scenarios + BMPS Now extended to include Best Management Practices A) BMP for present scenario B) BMP for intensive scenario
Triple Bottom Line Indicators • TBL indicators used • Social • Agricultural job numbers • Marine job numbers • Economic • Gross output ($/year) • Gross margin –land & ocean ($/year)
Triple Bottom Line Indicators • TBL indicators used • Environmental • Nitrogen load leaving catchment (kg/year) • Nitrogen in ocean (kg/year) • Low flow water take (m3/s) • Area of natural ecosystems (ha) • Carbon storage rate (tonnes/year) • Suspended sediment yield (tonnes/year)
Triple Bottom Line Indicators • What are the triple bottom line indicators that you would want to see for issues? • Social • Environmental • Economic