
Glacier Simulation Version 2 - Interactive Climate Change Tool
E N D
Presentation Transcript
Wendy Adams, Bob Anderson, Andrea Bair, Chris Malley, Archie Paulson, Kathy Perkins Oct 30, 2007 http://www.colorado.edu/physics/EducationIssues/archie/GlacierSim/ Glacier Simversion 2
Changes in Version 2 Changes in approximate order of importance: • 3-panel zoom interface • three panels 'map view' on top, 'main view' in the middle, and control panel at the bottom • main view changes when the little box in map view is dragged • climate controls now have options for setting rates of climate change • tools are now in a toolbox, whence they may be dragged out and placed on the glacier or valley floor. • new tools: • flag control (click on flag for info); only red flags; flags stick into ice a little bit; marker flags say 'right click for info!' when they're planted • ice thickness measure (calipers-like) • trash can (to remove tools) • crystals in ice and texture on the snow (will move with the ice velocity) • mass balance function appears on-screen (no popup) • top of glacier looks like ice below ELA and white snow above
Changes in Version 2 continued... • no longer any option to change valley floor • elevation line altitude (red dotted line) shown horizontally through the ice, along the top of the glacier, and on the map view • changed climate controls to standard radio buttons • aspect ratio is 1024x768 • no more option to change shape of valley floor • perspective change (no longer coming out of the plane of the sim) • new view checkbox "view follows terminus" (will be on by default) • 'Set Glacier to Equlibrium' button now on the bottom • time controls now standard (as in quantum bound states) • reset -> restart • new 'reset all' button • show -> view
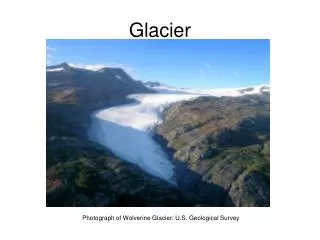
Basic Model (these will be provided in greater detail soon) • The glacier's thickness versus position and time depend on • shape/slope of valley floor • temperature (a linear function of elevation) • precipitation rate (also a linear function of elevation) • Temperature and precipitation can be combined to form a function called the mass balance, which equals growth (due to precip.) minus ablation (melt and sublimation). The mass balance gives the rate of change of glacier height per unit time as a function of elevation. • A mass balance which is constant in time results (eventually) in a steady-state glacier. In steady state, the glacier is flowing downhill as it gains ice over its upper half (positive mass balance) and loses ice over its lower half (negative mass balance). The line that divides these two regions is called the “equilibrium line”. • The velocity of the ice is nonzero at the bottom of the glacier (due to sliding), and increases with vertical height, as shown in the figure at the right. A simple model can be seen at the following website: http://www2.wwnorton.com/college/geo/egeo/flash/18_1.swf
little box shows which section of the valley is shown in the middle panel top panel shows map view of entire glacier valley texture shown in and on glacier – moves with ice velocity middle panel shows glacier cross section glacier color changes slightly at the equilibrium line toolbox in play area bottom panel is the control panel
After glacier retreat These little snow patches are just part of the background Moraine (rock) wall left behind
If the glacier has grown this box can be dragged to see the terminus (lower end) of the glacier. The box can also be dragged to any point in the valley. This checkbox (checked by default) makes the middle panel follow the glacier terminus, otherwise the view stays at the same place in the valley. The blue line shows the glacier's length.
Climate Controls • The control panel on the right panel controls climate by one of three methods (selected by radio buttons) • snowfall and temperature controlled independently (previous slides) • climate presets (in drop-down boxes) are selectors for certain values of snowfall & temperature (next slide): • “Epoch” can be “modern day” or “last glacial maximum” • “latitude” can be “equitorial” or “temperate” or “polar” • “altitude” can be “sea level” or “alpine” • edit mass balance by entering the three numeric values that are used to describe the function (after next slide): • altitude of the equilibrium line • slope of the linear mass balance function • maximum value of the mass balance • Each climate control has an additional setting for controling the rate of change of parameters • Once a climate control is changed, the glacier can be set to be at the steady-state shape for the current climate by pressing the button next to “Set glacier to equilibrium state.” Otherwise, the glacier will evolve in time until the steady-state is eventually achieved.
Snowfall & Temperature controlled independently Can also set their rates of change here
Climate presets set the snowfall & temp. according to some time and place Change control is slightly different
Directly edit the mass balance function The ELA can change in time
“View” Options In the “View” panel, the user can click one or more of the boxes. Results shown in the following slides. • “equilibrium line” shows the altitude of zero mass balance. • “ice velocities” shows a vector field of current ice velocity at all positions within the ice. • “debris” shows rocks which will flow along with the ice velocity and be deposited at the terminus. • “snowfall” will show the animated falling snow above the equilibrium line altitude (ELA). • “coordinates” will show elevation on the vertical axis and distance on the horizontal axis. • “mass balance” will pop up a window that shows the mass balance function. • “terminus tracker” will show an arrow with the current horizontal position and velocity of the glacier terminus. • “ruler” can be used to measure down-slope distance • “borehole drill” is a tool to drill vertical boreholes in the ice. It will start out as a vertical column and then deform, showing the differential velocities of the ice flow (shown in figure).
ELA should also be shown on map view Equilibriumn line and velocities checked on Ice velocity vectors Equilibrium Line Altitude (ELA)
Snowfall density will depend on altitude. Would nice if it were animated. View snowfall checked on
Rocks entrained in ice and riding along on top. The debris moves at the speed of the ice flow. Coordinates shown (down-valley distace and elevation) View debris and coordinates checked on Debris deposited at terminus
Borehole drill. Drills boreholes! Older boreholes deform according to the local ice velocity View terminus tracker and borehole drill checked on Ruler measures distance down-slope “Terminus tracker” is an indicator that follows the terminus and reads out it length and rate of change of length
Mass balace appears with the same vertical coordinates as the display (mass balance equals zero at the ELA) View mass balance and ruler checked on Ruler measures distance down-slope
Toolbox In the “Toolbox” the user sees various tools that can be dragged onto the glacier. There can be multiple instances of any tool on the glacier. They are removed by dragging to the trash. • “marker flag” allows the user to plant flags. On ice the flag will move with the ice flow. A flag can also be planted on the ground (to mark the terminus at some time, for example) – this flag can be covered and uncovered by the glacier. A right-click on any flag can give it's time of placement. It would be nice if there was a popup message appeared when dragging a flag out of the box to indicate that it has this right-click feature. • “thermometer” gives a temperature-measuring tool. It reports the atmospheric temperature. It should be excluded from the cross-section region since we don't keep track of ice temperatures. • “snow gauge” looks like a bucket. It can be dragged around and reports the local net snow accumulation. • “ice thickness measuring tool” can be placed on the glacier to read out its thickness at some point
Flags stick into the glacier cross-section and move with the ice velocity. Flags can be dragged out onto glacier Flags (and all other tools from the toolbox) can be removed by dragging them to the trash
Snow gauges show rate of snow/ice accumulation. Thermometers show local (adiabatic) temperature. Any tool from the toolbox can have multiple instances
Other Options (which would be nice) • show age of ice with contour lines (or colors?) • velocity vectors could also appear on glacier surface to show lateral variation in flow • option to change the slope or shape of the valley floor
The End That concludes the sim specification (as it exists so far). The remaining slides include motivations for this sim, including student difficulties, learning goals, and animations that exist on the web.
Student learning difficulties/misconceptions • Glaciers form only where it is very cold, and disappear with warming (not related to amount of snowfall) • Glaciers only form at high elevations or latitudes (T control); cannot form near sea level or at low latitudes (perhaps more a problem in Colorado, where most instructor examples are of alpine glaciers). • A glacier is a pile of ice that sits there once it forms; dynamics of ice movement in a “steady-state” glacier not known. • Glacial retreat means that ice is not moving but just melting back, or that the ice is literally moving uphill. • No sense of how long it takes glaciers to form, or change. • More melting (more water) makes a glacier flow faster; thus, increased temperature can make the whole thing slide downhill.
Learning Goals and objectives • Describe how glaciers form, grow, and shrink – specify what environmental conditions lead to each. • Identify where net ablation (~melting>snowfall) and accumulation (~melting<snowfall) occur in relation to the Equilibrium Line Altitude (ELA). • Explain or illustrate how glaciers form. • Describe the most important controls on mass balance in a glacier. • Analyze the relationship between temperature and the likelihood of snow vs. rain at given parts of a glacier. • Explain how ice moves within a glacier (describe and illustrate the mass balance of a glacier). • Describe and illustrate how glacial ice moves. • Qualitatively describe the relationship between the speed of ice flow and with ice thickness, and predict where ice is oldest. • Describe why and how valley glaciers “advance” or “retreat”. When the glacier retreats, does ice move up the glacial valley? • Compare and contrast motion of ice when a glacier is (1) at equilibruim, (2) advancing, and (3) retreating. • Compare and contrast climatic conditions leading to glacial (1) equilibruim, (2) advance, and (3) retreat. • Determine how multiple advance-retreat cycles affect the record of glacial moraines (end moraines). • Describe how end moraines form. • Discuss how more recent, large advances can impact moraines left by older, smaller advances. • Given an illustration of 3-4 end moraines, determine the most likely order of their formation and justify your ordering.