Download
1 / 78
800 likes | 853 Vues
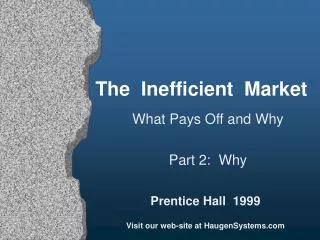
Explore the impact of abnormal profits on stock valuations and market efficiency in "The Inefficient Market: What Pays Off and Why." Learn about overpriced, underpriced, and value stocks, and the implications for portfolio positioning. Discover the dynamics of mean-reversion in profitability and the market's reactions to success and failure.

E N D
The Inefficient Market What Pays Off and Why Part 2: Why Prentice Hall 1999 Visit our web-site at HaugenSystems.com
The Topography of the Stock Market
True Abnormal Profit • Best estimate (using all relevant information and state-of-the-art analysis) of the risk adjusted, present value of a firms future abnormal profits.
under-priced stock The Position of Portfolios in Abnormal Profit Space True Abnormal Profit Efficient Market Line Growth Stocks Priced Abnormal Profit Value Stocks
The Position of Portfolios in Abnormal Profit Space True Abnormal Profit Efficient Market Line will produce excess return Growth Stocks Priced Abnormal Profit Value Stocks over-priced stock
The Position of Portfolios in Abnormal Profit Space True Abnormal Profit Efficient Market Line will produce excess return Growth Stocks Priced Abnormal Profit Value Stocks will produce deficient return
The Position of Portfolios in Abnormal Profit Space True Abnormal Profit Efficient Market Line Priced Abnormal Profit
The Position of Portfolios in Abnormal Profit Space True Abnormal Profit Efficient Market Line Priced Abnormal Profit
The Position of Portfolios in Abnormal Profit Space True Abnormal Profit Efficient Market Line Priced Abnormal Profit
The Position of Portfolios in Abnormal Profit Space True Abnormal Profit Efficient Market Line Priced Abnormal Profit
The Position of Portfolios in Abnormal Profit Space True Abnormal Profit Efficient Market Line Priced Abnormal Profit
The Position of Portfolios in Abnormal Profit Space True Abnormal Profit Efficient Market Line Priced Abnormal Profit
The Position of Portfolios in Abnormal Profit Space True Abnormal Profit Efficient Market Line Priced Abnormal Profit
The Position of Portfolios in Abnormal Profit Space True Abnormal Profit Efficient Market Line Priced Abnormal Profit
The Position of Portfolios in Abnormal Profit Space True Abnormal Profit Efficient Market Line PricedAbnormal Profit
The Position of Portfolios in Abnormal Profit Space True Abnormal Profit Efficient Market Line PricedAbnormal Profit
The Position of Portfolios in Abnormal Profit Space True Abnormal Profit Efficient Market Line PricedAbnormal Profit
The Position of Portfolios in Abnormal Profit Space True Abnormal Profit Efficient Market Line PricedAbnormal Profit
The Position of Portfolios in Abnormal Profit Space True Abnormal Profit Efficient Market Line PricedAbnormal Profit
The Position of Portfolios in Abnormal Profit Space True Abnormal Profit Efficient Market Line PricedAbnormal Profit
The Position of Portfolios in Abnormal Profit Space True Abnormal Profit Efficient Market Line IMPRECISION: Different prices for stocks with the same TRUE Abnormal Profit PricedAbnormalProfit Available assets
The Position of Portfolios in Abnormal Profit Space True Abnormal Profit Efficient Market Line IMPRECISION: Stocks with the same price have different TRUE abnormal profit PricedAbnormalProfit Available assets
Available assets The Position of Portfolios in Abnormal Profit Space True Abnormal Profit Efficient Market Line low B/P decile or high E/B decile PricedAbnormalProfit high B/P decile or low E/B decile
Mean-reversion in Relative ProfitabilityHow Fast? Fuller, Huberts, and Levinson 1973 - 1990
Relative Subsequent Growth in Highest, High, Low and Lowest Quintiles of E/P Ratio 8 Years ahead Lowest E/P(Growth) 7 Years ahead Number of Years After Ranking Low E/P High E/P 6 Years ahead Highest E/P (Value) 5 Years ahead 4 Years ahead 3 Years ahead 2 Years ahead 1 Year ahead -10% -8% -6% -4% -2% 0% 2% 4% 6% 8% 10% Growth in Earnings per Share Relative to Middle Quintile
Is the Market Surprised by the Speed of Mean-reversion? La Porta, Lakonishok, Shleifer, & Vishny 1971-1992
Value Growth -2.0% -1.5% -1.0% -0.5% 0.0% 0.5% 1.0% 1.5% 2.0% Three day rate of return Returns of Growth and Value Stocks Around Earnings Announcement Dates Fifth year following ranking Fourth year following ranking Third year following ranking Second year following ranking First year following ranking
Available assets The Position of Portfolios in Abnormal Profit Space True Abnormal Profit Efficient Market Line low B/P decile or high E/B decile PricedAbnormal Profit high B/P decile or low E/B decile
Available assets The Position of Portfolios in Abnormal Profit Space True Abnormal Profit Efficient Market Line low B/P decile or high E/B decile PricedAbnormal Profit high B/P decile or low E/B decile
Available assets The Position of Portfolios in Abnormal Profit Space True Abnormal Profit Efficient Market Line low B/P decile or high E/B decile PricedAbnormal Profit high B/P decile or low E/B decile
Available assets The Position of Portfolios in Abnormal Profit Space True Abnormal Profit Efficient Market Line low B/P decile or high E/B decile PricedAbnormal Profit high B/P decile or low E/B decile
Available assets The Position of Portfolios in Abnormal Profit Space True Abnormal Profit Efficient Market Line low B/P decile or high E/B decile PricedAbnormal Profit high B/P decile or low E/B decile
Available assets The Position of Portfolios in Abnormal Profit Space True Abnormal Profit Efficient Market Line low B/P decile or high E/B decile PricedAbnormal Profit high B/P decile or low E/B decile
Available assets The Position of Portfolios in Abnormal Profit Space True Abnormal Profit Efficient Market Line low B/P decile or high E/B decile PricedAbnormal Profit high B/P decile or low E/B decile
Available assets The Position of Portfolios in Abnormal Profit Space True Abnormal Profit Efficient Market Line low B/P decile or high E/B decile PricedAbnormal Profit high B/P decile or low E/B decile
Available assets The Position of Portfolios in Abnormal Profit Space True Abnormal Profit Efficient Market Line low B/P decile or high E/B decile PricedAbnormal Profit high B/P decile or low E/B decile
Available assets The Position of Portfolios in Abnormal Profit Space True Abnormal Profit Efficient Market Line low B/P decile or high E/B decile PricedAbnormal Profit high B/P decile or low E/B decile
Available assets The Position of Portfolios in Abnormal Profit Space True Abnormal Profit Efficient Market Line low B/P decile or high E/B decile PricedAbnormal Profit high B/P decile or low E/B decile
Available assets The Position of Portfolios in Abnormal Profit Space True Abnormal Profit Efficient Market Line low B/P decile or high E/B decile PricedAbnormal Profit high B/P decile or low E/B decile
Available assets The Position of Portfolios in Abnormal Profit Space True Abnormal Profit BIAS: Overreaction to Abnormal Profit Efficient Market Line over-priced Priced low B/P decile or high E/B decile True high B/P decile or low E/B decile PricedAbnormal Profit under-priced
Available assets The Position of Portfolios in Abnormal Profit Space True Abnormal Profit Efficient Market Line Growth investors head North PricedAbnormal Profit Value investors head West
Available assets The Position of Portfolios in Abnormal Profit Space True Abnormal Profit Efficient Market Line will under perform GARP Pure Growth will outperform market PricedAbnormal Profit
The Position of Portfolios in Abnormal Profit Space True Abnormal Profit Efficient Market Line Super Stocks PricedAbnormal Profit Stupid Stocks
What’s Behind the Payoff to Profitability? Imprecision - you can buy more profitable companies without having to pay more expensive prices.