Download
1 / 139
1.39k likes | 1.41k Vues
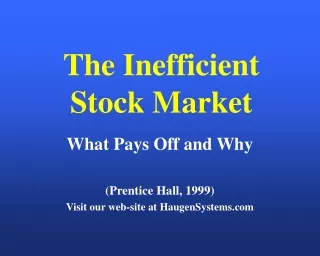
The Inefficient Stock Market. What Pays Off and Why (Prentice Hall, 1999) Visit our web-site at HaugenSystems.com. Background:. The evolution of academic finance. 1930’s. 40’s. 50’s. 60’s. 70’s. 80’s. 90’s. beyond. The Evolution of Academic Finance. The Old Finance. The Old Finance

E N D
The Inefficient Stock Market What Pays Off and Why (Prentice Hall, 1999) Visit our web-site at HaugenSystems.com
Background: • The evolution of academic finance.
1930’s 40’s 50’s 60’s 70’s 80’s 90’s beyond The Evolution of Academic Finance The Old Finance The Old Finance Theme:Analysis of Financial Statements and the Nature of Financial Claims Paradigms: Security Analysis Uses and Rights of Financial Claims (Graham & Dodd)(Dewing) Foundation: Accounting and Law
1930’s 40’s 50’s 60’s 70’s 80’s 90’s beyond The Evolution of Academic Finance The Old Finance Bob goes to college Modern Finance Modern Finance Theme: Valuation Based on Rational Economic Behavior Paradigms: Optimization Irrelevance CAPM EMH (Markowitz)(Modigliani & Miller) (Sharpe, Lintner & Mossen) (Fama) Foundation: Financial Economics
1930’s 40’s 50’s 60’s 70’s 80’s 90’s beyond The Evolution of Academic Finance The Old Finance Bob goes to college The New Finance Modern Finance The New Finance Theme: Inefficient Markets Paradigms: Inductive ad hoc Factor Models Behavioral Models Expected Return Risk (Haugen) (Chen, Roll & Ross) (Kahneman & Tversky) Foundation: Statistics, Econometrics, and Psychology
Background: • The evolution of academic finance. • Estimating expected return with the Asset Pricing Models of Modern Finance • CAPM: strong assumption -- strong prediction
Expected Return Expected Return B C x x x x x x Market Index x x x x x x x x x x x A x x x x x x x Market Beta Risk (Return Variability) Market Index on Efficient Set Corresponding Security Market Line
Expected Return Expected Return Risk (Return Variability) Market Beta Market Index Inside Efficient Set Corresponding Security Market Cloud Market Index
Background: • The evolution of academic finance. • Estimating expected return with the Asset Pricing Models of Modern Finance • CAPM: strong assumption -- strong prediction. • APT: weak assumption -- weak prediction.
The Arbitrage Pricing Theory • Estimating the macro-economic betas.
Return to G.E. 25% 20% 15% 10% 5% 0% -5% -10% -15% -20% -25% -10% -5% 0% 5% 10% Percentage Change in Yield on Long-term Govt. Bond Relationship Between Return to General Electric and Changes in Interest Rates Line of Best Fit April, 1987
The Arbitrage Pricing Theory • Estimating the macro-economic betas. • No-arbitrage condition for asset pricing. • If risk-return relationship is non-linear, you can arbitrage.
Probability Distribution For Returns to a Portfolio Probability Variance of Return Possible Rates of Returns Expected Return
Risk Factor Models • The variance of stock returns can be split into two components: • Variance = systematic risk + diversifiable risk • Systematic risk is computed using the following spreadsheet.
Portfolio Beta Portfolio Beta (Inflation) (Oil Price) Portfolio Beta Correlation Between 1.00 Inflation and Oil Price (Inflation) Portfolio Beta Correlation Between 1.00 (Oil Price) Inflation and Oil Price Spreadsheet for Computing Systematic Risk
Risk Factor Models • Factor betas are estimated by relating stock returns to (unexpected) percentage changes in the factor over a period where the stock’s character is similar to the present.
Return to G.E. 25% 20% 15% 10% 5% 0% -5% -10% -15% -20% -25% -10% -5% 0% 5% 10% Percentage Change in Yield on Long-term Govt. Bond Relationship Between Return to General Electric and Changes in Interest Rates Line of Best Fit April, 1987
Monthly Percentage Change in Price of Oil 140 120 100 80 60 40 20 0 -20 -40 -1 -0.5 0 0.5 1 1.5 2 Monthly Rate of Inflation Relationship Between Rate of Inflation and Percentage Change in Price of Oil Line of Best Fit
Risk Factor Models • Factor correlations can be estimated over a longer period because they are, presumably, more stable over time. This may increase the predictive accuracy of factor models relative to more naïve historical estimates.
Portfolio Beta * Portfolio Beta * 1.00 (Inflation) (Inflation) + Portfolio Beta * Portfolio Beta * Correlation Between (Oil Price) Inflation and Oil Price (Inflation) Portfolio Beta * Portfolio Beta * 1.00 + (Oil Price) (Oil Price) + Portfolio Beta * Portfolio Beta * Correlation Between Inflation and Oil Price (Oil Price) (Inflation) = Portfolio Systematic Risk Computing Portfolio Systematic Risk
Risk Factor Models • If your factors have truly captured the structure behind the correlations between stock returns, then portfolio diversifiable risk can be estimated by summing the products of (a) the diversifiable risk of each stock and (b) the square of its portfolio weight.
.10 .09 .08 .07 .06 Diversifiable Risk .05 .04 .03 .02 .01 .00 1 4 7 10 13 16 19 22 25 28 31 34 Number of Stocks in Portfolio 37 40 DiversifiableRisk Decreases with the Number of Stocks in a Portfolio
Expected Return Factor Models • The factors in an expected return model represent the character of the companies. They might include the history of their stock prices, its size, financial condition, cheapness or dearness of prices in the market, etc. • Factor payoffs are estimated by relating individual stock returns to individual stock characteristics over the cross-section of a stock population (here the largest 3000 U.S. stocks).
100% 50% Total Return 0% Line of Best Fit -50% -100% -1.5 -1.0 -0.5 0.0 0.5 1.0 1.5 2.0 2.5 3.0 Book to Price Relationship Between Total Return and Book to Price Ratio January, 1981
Five Factor Families • Risk • Liquidity • Price level • Growth potential • Price history
The Most Important Factors • The monthly slopes (payoffs) are averages over the period 1979 through mid 1986. “T” statistics on the averages are computed, and the stocks are ranked by the absolute values of the “Ts”.
1979/01 through 1986/07 through 1993/12 1986/06 Factor Mean Confidence Mean Confidence One-month excess return -0.97% 99% -0.72% 99% Twelve-month excess 0.52% 99% 0.52% 99% return Trading volume/market -0.35% 99% -0.20% 98% cap Two-month excess return -0.20% 99% -0.11% 99% Earnings to price 0.27% 99% 0.26% 99% Return on equity 0.24% 99% 0.13% 97% Book to price 0.35% 99% 0.39% 99% Trading volume trend -0.10% 99% -0.09% 99% Six-month excess return 0.24% 99% 0.19% 99% Cash flow to price 0.13% 99% 0.26% 99% Most Important Factors
Projecting Expected Return • The components of expected return are obtained by multiplying the projected payoff to each factor (here the average of the past 12) by the stock’s current exposure to the factor. Exposures are measured in standard deviations from the cross-sectional mean. • The individual components are then summed to obtain the aggregate expected return for the next period (here a month)
Factor Exposure Payoff Component Book\Price 1.5 S.D. x 20 B.P. = 30 B.P. Short-Term Reversal 1.0 S.D. x -10 B.P. = -10 B.P. . . . . . . . . . . . . . . . . . . . . . . . . Trading Volume -2 S.D. x -20 B.P. = 40 B.P. Total Excess Return 80 B.P. Estimating Expected Stock Returns
The Model’s Out-of-sample Predictive Power • The 3000 stocks are ranked by expected return and formed into deciles (decile 10 highest). • The performance of the deciles is observed in the next month. Then expected returns are re-estimated, and the deciles are re-ranked. • The process continues through 1993.
Realized Return 30% 20% 10% 0% -10% -20% -30% -40% 0 1 2 3 4 5 6 7 8 9 10 Decile Realized Return for 1984 by Decile (Y/X = 5.5%) Y X
Extension of Study to Other Periods(Nardin Baker) • The same family of factors is used on a similar stock population. • Years before and after initial study period are examined to determine slopes and spreads between decile 1 and 10.
Slope and Spread 100% 90% difference slope 80% 70% 60% 50% 40% 30% 20% 10% 0% 1975 1977 1979 1981 1983 1985 1987 1989 1991 1993 1995 1997 1998 Years
Decile Risk Characteristics The characteristics reflect the character of the deciles over the period 1979-1993.
Fama-French Three- Factor Model Monthly decile returns are regressed on monthly differences in the returns to the following: S&P 500 and T bills. The 30% of stocks that are smallest and largest. The 30% of stocks with highest book-to-price and the lowest.
Market Beta 1.25 1.2 1.15 1.1 1.05 Decile 1 1 2 3 4 5 6 7 8 9 10 0.95 Sensitivities (Betas) to Market Returns
Size Beta 0.5 0.4 0.3 0.2 0.1 0 Decile 1 2 3 4 5 6 7 8 9 10 Sensitivities (Betas) to Relative Performance of Small and Large Stocks
Value/Growth Beta 0.3 0.2 0.1 10 8 9 Decile 0 1 2 3 4 5 6 7 -0.1 -0.2 Sensitivities (Betas) to Relative Performance of Value and Growth Stocks
Fundamental Characteristics Averaged over all stocks in each decile and over all months (1979-83)
Interest Coverage Stock Market Beta Volatility Debt to Equity 50% 8 Coverage 6.63 41.42% 7 40% 6 33.22% 5 Volatility 30% 4 20% 3 2 1.76 10% Beta 1.21 1.00 1 1.03 Debt to Equity 0.85 0% 0 1 2 3 4 5 6 8 9 10 7 Decile Decile Risk Characteristics
Stock Price Size Trading Volume $70 $1,100 $60.89 $60 $1,000 Trading Volume $1011 $50 $900 $42.42 $40 $800 Size $30 $700 $30.21 Price $20 $600 $14.93 $10 $500 $470 $0 $400 1 2 3 4 5 6 7 8 9 10 Decile Size and Liquidity Characteristics
Excess Return 30.01% 30% 12 months 16.60% 20% 6 months 10% 8.83% 3 months 2 months 0.09% 1.21% 0% -0.14% 1 month -1.80% -6.89% -10% -12.14% -15.74% -20% 1 2 3 4 5 6 7 8 9 10 Decile Technical History
Profit Margin Return on Assets Return on Equity Earnings Growth Asset Turnover Asset Turnover 20% 120% 115% Return on Equity 15.39% 110% 10% 7.86% Profit Margin 6.50% 100% Return on Assets 0% 0.95% Earnings Growth 90% -10% 80% 1 2 3 4 5 6 7 8 9 10 Decile Current Profitability