Download
1 / 16
180 likes | 214 Vues
Learn to use Excel Solver for polynomial analysis, intricate nonlinear equations, and design optimization. Understand how to set up and solve complex problems using Excel's numeric Solver tool. Discover how to enhance traditional designs and maximize solutions effectively.

E N D
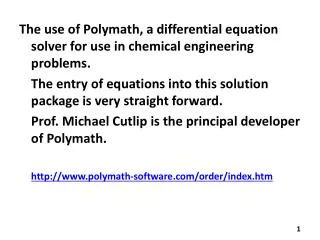
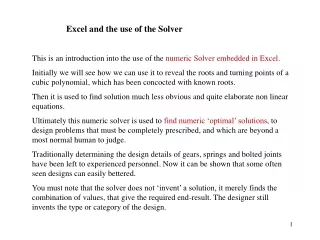
Excel and the use of the Solver This is an introduction into the use of the numeric Solver embedded in Excel. Initiallywe will see how we can use it to reveal the roots and turning points of a cubic polynomial, which has been concocted with known roots. Then it is used to find solution much less obvious and quite elaborate non linear equations. Ultimately this numeric solver is used to find numeric ‘optimal’ solutions, to design problems that must be completely prescribed, and which are beyond a most normal human to judge. Traditionally determining the design details of gears, springs and bolted joints have been left to experienced personnel. Now it can be shown that some often seen designs can easily bettered. You must note that the solver does not ‘invent’ a solution, it merely finds the combination of values, that give the required end-result. The designer still invents the type or category of the design.
This is just text reminding the user what this s.s. is about This is just text reminding the user the name of the variable in the cell to its right Cell C12 is named ‘a_2’ (see the name box)and its value is -3.5, it is calculated as the sum of the 3 coefficients x_1, x_2 & x_3 The previous cubic is entered in Excel in away that may be read easily Note the ‘name box’ is used here to give the numerical content of the cell a name, not just cell coordinates, that may then be used in equations. Subscripted variables may be represented with underscores eg x_1, a_2 etc. Excel has vector and matrix functions but it is not represented as done in Matlab name box The Use of Excel in Design analysis & CalculationsAndrei Lozzi 2016
I copied the content of C18 to E18, delete the ‘=‘ sign leaving a text version of the otherwise unseen equation behind cell C18 A column of independent variables xs are entered, associated dependent ys are calculated. The box is highlighted and a scatter diagram is chosen from the Chart Wizard
Cells B26 and C26 We copied a single pair of independent and dependent variables to B26 & C26. Select Tools/Solver, this permits the selection of the object function, ie the ‘Target Cell’ and the independent variable(s), ie ‘Changing Cells’. Note that the starting values of the search for the maximum ‘y’ are the values in the cells B26 & C26. The solver is a numeric not an a symbolic tool, it will gives only approximations.
Local maximum, approximately (-0.6,15) Here the correctness of the Solver’s solution can only be verifiedwithin the resolution of the graph, but the range and density of the gridlines on the graph can be adjusted to give better resolution.
We now seek to find the min value of the cubic, using x = -4 as the starting point. The Solver finds the nearest or local condition required of the object function. The solver does not execute a global or a guided search.This initial condition for x & y tend to negative infinity, to limit the search we can add constraints.
Title and purpose of this spread sheet Name of s.s. file An example of a layout for a s.s. The intentions is to make the file easily readable, used by others expanded by yourself and assessed by your supervisor. If your marker or supervisor cannot understand they will not give you the benefit of the doubt they will mark you down. Description of variable units Symbol used in equations Equation to calculate variable Value of variable
In the search for some ‘optimal’ solution in design, where there are multiple variables, it is often necessary to use constraining relationships to eliminate nonsense answers. We have a rectangular prism representing a container for which we want to minimise the cost of the material or limit the heat transfer through the surfaces. The question is what are the proportions of the sides so that the surface area is a minimum. If we search for the smallest surface area, L, W & H will all tend to 0. Giving a box of no volume. An appropriate constraint may be taken to be that the volume be =1.
The search is then for the dimensions of a rectangular prism with the smallest surface area but fixed volume. Here we used a Volume =1 as the constraint. Fortunately essentially all practical engineering problems have fairly easily recognisable solutions, obvious constraints and limited pitfalls, unlike the sort of functions that mathematicians are fond of examining. What do you expect the lengths of the sides to be?
The previous example is deceptively easy and quick. In an attempt to search for the limitations in the capacity of PCs and this solver, the 3 dimensional prism can be extended to higher dimensions The search for the lengths of the length sides of a 13 dimension prism, of min surface area, but which meets 10 boundary conditions, ie all volumes from the 3rd dimension to the 13th are all required to be 1. Limits to: time, cycles, tolerance, method of approximations etc.
Not so long ago a PC would bog down long before the 13th dimension, not at all now. A few years ago a 1 mega-flop computer would cost $1 M. To day new PCs can do much better. It would take a human with a calculator more than 2 years to do a mega-flop. This indicates to me that the ultimate power of PCs has barely been explored.
The function for the 13th dimensionsurface area has 78 non linear terms !!
OVERVIEW ON THE USE OF THE SOLVER It may not initially be entirely obvious to you, but the solver is not psychic, the value in the cell that you try to ‘optimise’ must be a function of the cells that you declare as variables. The boundary conditions can be limits to the variables themselves or functions of those variables. The objective function, that you wish to come to some desired value, here referred to as the Target Cell, can be set to maximise, minimise or reach a particular value. The independent variables, that is the cells that you can declare as variables, are identified within By Changing Cells box. hence it is necessary that you have a continuous chain of relationships (equations), beginning with the independent variables to the objective function. This chain must extend to teach of the constraints, identified within Subject to the Constraints. If you have any discontinuity from the independent variables to the dependent variables, you will get nonsense. You can also generate nonsense many other ways. The advantage of this ‘Solver’ is that you get feedback very quickly
A real and very useful application is to find the parameters of a pair of gears that have an equal margin of safety against failure in 4 areas, two in each gear: Compressible failure A, on each. Tensile failure at B, at the base of opposite teeth. A chain is no stronger that its weaker link. The lowest factor of safety limits the capacity of the gear pair
Each variable shown here is a function of other variables. There are 2 sets of such equations one for each gear In a gear box there are many such sets, and in an industrial plant there may be many such boxes
If we are provided with the mean and alternating pressures in the cylinder: Pm, Pa, for n number of bolts, of grade X.Y we can calculate the diameter d and length lthat will give a mean and alternating stresses σm, σa in the bolts, that will be below the Gerber parabola. The diameter and length of the bolts will determine the dimensions of the flange, D & C and hence its volume V. All this will give us just a ‘working solution’ not the lightest nor the cheapest. We can find an ‘optimal’ solution for this design by begging from where we finished and going backwards. We can set the solver to find the smallest volume V(d,l) by varying n, d, l,such that σm, σa will be below the Gerber parabola, for the given the pressures Pm, Pa.