Download

1 / 23
230 likes | 254 Vues
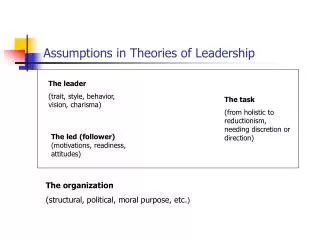
Assumptions in using SNPs to estimate trait heritability among ‘ unrelated ’ individuals. Matthew Keller Teresa de Candia University of Colorado at Boulder. Outline. Overview of estimating genetic variance tagged by SNPs how it works: HE-regression example how to interpret SNP h 2

E N D
Assumptions in using SNPs to estimate trait heritability among ‘unrelated’ individuals Matthew Keller Teresa de Candia University of Colorado at Boulder
Outline • Overview of estimating genetic variance tagged by SNPs • how it works: HE-regression example • how to interpret SNP h2 • assumptions using GREML approach • assortative mating & GREML/HE biases
Regression estimates of VA product of centered scores (here, z-scores) (the slope of the regression is an estimate of standardized VA (i.e., h2)
Regression estimates of VA average correlation between 2 genotypes across ALL MEASURED SNPS: (the slope of the regression is an estimate of standardized VA (i.e., h2)
Regression estimates of VA (the slope of the regression is an estimate of standardized VA (i.e., h2)
Regression estimates of VA COV(MZ) (the slope of the regression is an estimate of standardized VA (i.e., h2)
Regression estimates of VA COV(DZ) (the slope of the regression is an estimate of standardized VA (i.e., h2)
Regression estimates of VA 2*[COV(MZ)-COV(DZ)]= h2 = slope (the slope of the regression is an estimate of standardized VA (i.e., h2)
Regression estimates of VA (the slope of the regression is an estimate of standardized VA (i.e., h2)
Regression estimates of VA (the slope of the regression is an estimate of standardized VA (i.e., h2)
Regression estimates of VA_snp (the slope of the regression is an estimate of standardized VA_SNP (i.e., h2_SNP)
But how to interpret this “SNP” h2 (h2snp) average correlation between 2 genotypes across ALL (k=1…m) MEASURED SNPS: To estimate total narrow h2, we’d need the average correlation between 2 genotypes across ALL (k=1…q) CAUSAL VARIANTS:
But how to interpret this “SNP” h2 (h2snp) To the degree isn’t predicted well by , WHEN is not well predicted by ? This is actually the usual case, and it is not a bad thing! It happens to the degree that (typically unmeasured) causal variants aren’t well tagged by (in high LD with) measured SNPs E.g., rare causal variants.
Interpreting h2 estimated from SNPs (h2snp) • If close relatives included (e.g., sibs), h2snp≅ h2 estimated from a family-based method. Thus, interpret h2snp as you would h2 from AE model (including all biases!). • If use only distant ‘relatives’(the usual approach; e.g., pihat< .05): • h2snp = proportion of VP due to VA captured by common SNPs. Upper bound of % VP GWAS can detect • Gives idea of the aggregate importance of causal variants tagged by SNPs (mostly common ones b/c rare ones poorly tagged by common SNPs) • By not using relatives who also share environmental effects: (a) VA estimate 'uncontaminated' by VC & VNA; (b) does not rely on assumptions required in family studies (e.g., r(MZ) > r(DZ) for only genetic reasons)
Big picture: using SNPs to estimate h2 • It is an independent approach to estimating heritability • Its assumptions are different from family-based models. It takes increasingly tortuous reasoning to suggest trait X isn’t heritable because methodological flaws in estimating h2 • It provides a downwardly biased estimate of h2 – and this is good! • h2snp helps elucidate the genetic architecture of complex traits • The “still missing” h2 (h2family – h2snp) provides insight into the importance of rare variants, non-additive genetics, or over-estimation of h2twin. • But it is not a panacea! • Many issues still need to be worked out. As with twin designs, we can be misled under certain scenarios (e.g., assortative mating, maternal effects, etc.). Is an active area of research.
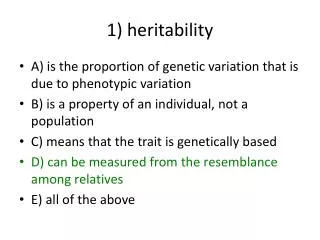
Unimportant assumptions in estimating h2snp See excellent paper by Speed et al, 2012, who investigated the following and found that these violations had little effect on estimates: Genetic and error effects are normally distributed effect sizes of causal variants is proportionate to 1/2pq (low MAF variants have bigger effects) All SNPs have an association with the phenotype
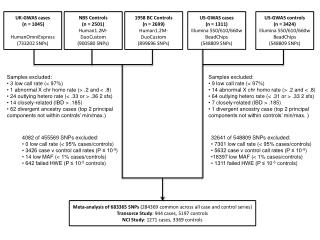
Important assumptions in estimating h2snp • There is no correlation between environmental similarity and SNP_pihats. A common way this can occur is in stratified samples: • E.g., estimating h2snp of diabetes in a sample that incudes Native Americans and Caucasians would get a serious inflation in h2snp. This be dealt with by controlling for principal components of GRM • Another way: cases and controls genotyped separately • The avg. LD between causal variants (CVs) & SNPs is the same as the average LD between SNPs and other SNPs. • If E[r(CV,SNP)] > E[r(SNP,SNP)], you overestimate h2snp (and vice-versa) • The average LD between CVs is same as between SNPs. • If E[r(CV,CV)] > E[r(SNP,SNP)], you overestimate h2snp (and vice-versa).
Important assumptions in estimating h2snp • There is no correlation between environmental similarity and SNP_pihats. A common way this can occur is in stratified samples: • E.g., estimating h2snp of diabetes in a sample that incudes Native Americans and Caucasians would get a serious inflation in h2snp. This be dealt with by controlling for principal components of GRM • Another way: cases and controls genotyped separately • The avg. LD between causal variants (CVs) & SNPs is the same as the average LD between SNPs and other SNPs. • If E[r(CV,SNP)] > E[r(SNP,SNP)], you overestimate h2snp (and vice-versa) • The average LD between CVs is same as between SNPs. • If E[r(CV,CV)] > E[r(SNP,SNP)], you overestimate h2snp (and vice-versa).
Assortative mating & estimating h2snp • As discussed Thursday, AM biases estimates of VA down and VC up in twin studies. What kind of effect does it have on SNP-heritability estimates? • Two years ago at this workshop, there was an interesting debate (and bet – no-one won) about effects AM would have on GCTA estimates. • AM leads to very long-range LD between CVs themselves, but not between other parts of the genome (SNPs that don’t tag CVs) • After much work by de Candia, Eaves, Carey, Evans, and myself: • AM leads to an upward bias in estimates of equilibrium h2snp • This occurs because AM creates covariances between CVs and these are correctly reflected in phenotypic covariances between individuals but poorly reflected in pihat matrix. Thus, variance of pihats is underestimated. Underestimating variance in a predictor leads to overestimates of the coefficients associated with that predictor.
Background and Previous Results • Increases genetic variance in population by creating correlations among increasing alleles within individuals. • Previously we had simulated very simplistic "genomes" of multivariate normally distributed causal variants. • We analytically predicted and observed that, under AM, HE regression produces overestimates of equilibrium genetic variance • We also observed, but did not analytically prove, that REML estimates are unstable across increasing sample size (decreasing)& increasing number of markers (increasing)
Current Results - Simulations • Simulated populations over 20 generations of mating under varying levels of AM for a single trait using GeneEvolve (RasoolTahmasbi). • No. populations: 3 • CVs: 1000 • Heritability: 0.5 • Relative pruning: >.05 • Spousal phenotypic correlation: .4