Pleural cavities
Pleural cavities. Diaphragm. Right pleural cavity. Left pleural cavity. Fig. 17-11. Pleural cavities. Pleural membranes. Right . lung. Left . lung. Heart. Right pleural cavity. Pericardial cavity. Left pleural cavity. Fig. 17-2. P = –3 mm Hg. Ribs. Intrapleural space.

Pleural cavities
E N D
Presentation Transcript
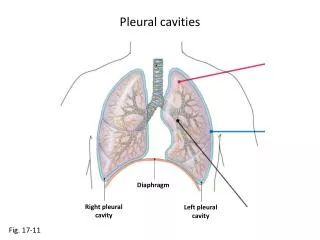
Pleural cavities Diaphragm Right pleuralcavity Left pleuralcavity Fig. 17-11
Pleural cavities Pleuralmembranes Right lung Left lung Heart Right pleuralcavity Pericardialcavity Left pleuralcavity Fig. 17-2
P = –3 mm Hg Ribs Intrapleuralspace Pleuralmembranes Diaphragm Fig. 17-12
Pneumothorax P = Patm Knife Lung collapses tounstretched size Air Intrapleuralspace Pleuralmembranes The rib cageexpands slightly. If the sealed pleural cavity is openedto the atmosphere, air flows in. Fig. 17-12
Alveolar ventilation 150mL 1 2700 mL 150 350 2 150mL 150 350 2200 mL 150 2200 mL 4 150mL 3 2200 mL Fig. 17-14
MALES FEMALES Hematocrit 40%–54% 37%–47% Hemoglobin (g Hb/dL* blood) 14–17 12–16 Red cell count (cells/µL) 4.5–6.5 x 10⁶ 3.9–5.6 x 10⁶ Total white cell count (cells/µL) 4–11 x 103 4–11 x 103 58%plasmavolume Differential white cell count Neutrophils 50%–70% 50%–70% Eosinophils 1%–4% 1%–4% Basophils <1% <1% 100% Lymphocytes 20%–40% 20%–40% Monocytes 2%–8% 2%–8% <1%whitecells Platelets (per µL) 150–450 x 103 150–450 x 103 *1 deciliter (dL) = 100 mL 42%packedred cellvolume Fig. 16-3
Blood composition Amino acids Albumins Water Globulins Proteins Ions Fibrinogen Glucose iscomposedof Organicmolecules BLOOD such as Plasma Lipids Nitrogenouswaste Trace elementsand vitamins CO2 such as Gases O2 Fig. 16-1
Blood composition Lymphocytes Red bloodcells Monocytes iscomposedof Cellularelements Whiteblood cells include BLOOD Neutrophils Platelets m 0 Eosinophils 5 10 15 Basophils Fig. 16-1
Hemoglobin Chain Chain Hemegroup Porphyrinring R = additional C, H, O groups Fig. 18-8
Control centers KEY DRG = Dorsal respiratory group VRG = Ventral respiratory group Higherbraincenters Pons Medullarychemo-receptors Peripheral chemo-receptors DRG Medulla pre-Bötzingercomplex VRG Output to expiratory,some inspiratory,pharynx, larynx, andtongue muscles Outputprimarily toinspiratorymuscles Fig. 18-17