Download
1 / 33
330 likes | 490 Vues
James Dewar presenting liquid hydrogen: Physics Today, March 2008. Effects of Anomalies in Ancillary Data on Cloud and Radiation Products of the ISCCP and SRB Projects? (Seminar at CIRA, March, 11, 2008) by Ehrhard Raschke (Hamburg) Stefan Kinne (Hamburg)

E N D
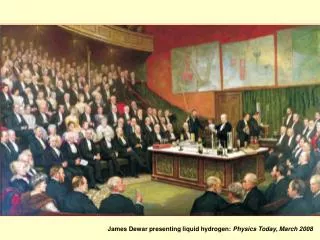
James Dewar presenting liquid hydrogen: Physics Today, March 2008
Effects of Anomalies in Ancillary Data on Cloud and Radiation Products of the ISCCP and SRB Projects? (Seminar at CIRA, March, 11, 2008) by Ehrhard Raschke (Hamburg) Stefan Kinne (Hamburg) With contributions fromEly Duenas (GISS, NY) Yuan-C. Zhang (GISS, NY) William B. Rossow (GISS, NY)
1991 - 1995 Planetary Albedo:31, 31, 30 % surface albedo 13, 15,15% Surface temperature 15.2, 14, 14 K
We intend to demonstrate that the information by ancillary data has already introduced errors into final products. We will also discuss briefly differences of ISCCP to IPCC results.
SOLAR RADIATION Primarily affected by Insolation, clouds, aerosols, surface reflectance + “second order characteristics”
LONGWAVE RADIATIONprimarily affected by skin temperatureatmospheric temperature, water vaporcloud cover and cloud top and base heights + “second order characteristics”
ISCCP: Surface temperature and reflectance; water vapor & air temperature are the most important ancillary data. http://ISCCP.giss.nasa.gov
Deseasonalised monthly global averages of the clear sky downward solar radiationat the surface, of the projects ISCCP and SRB.
Downward solar at surface: left (monthly - deseasonalised vs. 1/85 to 12/88); right (annual anomalies with respect to 21 year average) ISCCP SRB
Anomalies of the effective surface albedo (ratios up-to-down) ISCCP clear SRB clear
Upward solar radiation at TOA: left (monthly - deseasonalised vs. 1/85 to 12/88); right (annual averages) ISCCP SRB
Longwave radiation: Skin temperature vs. emission, dw lw and its CE at surface
Upward (lem) and downward (lds) fluxes of longwave radiation at surface ISCCP SRB
Total net radiation at surface Total net radiation at TOA
solar infrared DIV CE of DIV
Annual averages of differences between CERES and ISCCP 2000 - 2003 A = Incident solar at TOA X = Effective surface albedo E = Emission from surface D = Outgoing solar at TOA F = Outgoing infrared at TOA Dd = CE on outgoing solar at TOA Bb = CE on downward solar at surface Ff = CE on outgoing infrared at TOA Hh = CE on downward infrared at surface
Annual averages of differences between SRB and ISCCP 2000 - 2003 A = Incident solar at TOA X = Effective surface albedo E = Emission from surface D = Outgoing solar at TOA F = Outgoing infrared at TOA Dd = CE on outgoing solar at TOA Bb = CE on downward solar at surface Ff = CE on outgoing infrared at TOA Hh = CE on downward infrared at surface
Conclusion and Recommendation There is very strong evidence that natural and “artificial” anomalies in ancillary data cause anomalies in cloud and radiation products, which may cause (and had already caused in the past) false interpretations with respect to climate variations and their causes. We, therefore, recommend that all such ancillary data must be quality-inspected with respect to natural and “artificial” anomalies before their use in computations of cloud and radiation products. (These conclusions need to be considered also in other GEWEX data assessments!
Annual insolation in IPCC-4AR models observed Global averages (TSI/4) of monthly insolation at TOA: ISCCP minus SRB
Standard deviation of monthly radiation products of 22 IPCC-4AR models A = Incident solar at TOA X = Effective surface albedo E = Emission from surface D = Outgoing solar at TOA F = Outgoing infrared at TOA Dd = CE on outgoing solar at TOA Bb = CE on downward solar at surface Ff = CE on outgoing infrared at TOA Hh = CE on downward infrared at surface
Differences to ISCCP of MPI and all IPCC models: 12 year (1984-1995)averages A = Incident solar at TOA X = Effective surface albedo E = Emission from surface D = Outgoing solar at TOA F = Outgoing infrared at TOA Dd = CE on outgoing solar at TOA Bb = CE on downward solar at surface Ff = CE on outgoing infrared at TOA Hh = CE on downward infrared at surface
Clear sky emission from ground in ISCCP, SRB and CERES: global monthly averages from January 2001 to December 2003
Aerosol optical depth (global average over oceans) from ISCCP radiance data (Mishchenko et al. 2007, in 2 publications and at Gordon Conference) Almost 25% reduction from 1995 to 2005 ?
Annual average of total outgoing radiative fluxes to space for the 1984-1995 period (except for 2000-2003 for CERES) in W/m2. Data are displayed for three climatologies (ISC, CER, SRB), the IPCC-4AR model median and 20 IPCC-4AR models. The ISCCP here refers to the 4 year (2000-2003) CERES time-period.
Differences (1984 to 1995) of downward solar (left) and longwave (right) radiation at surface for cloudy (top) and clear skies (middle row) and of the cloud effect (bottom) cloudy clear cloud effects