Mastering Terminal Arrival Efficiency Rate (TAER) Metrics
130 likes | 224 Vues
Understand the Terminal Arrival Efficiency Rate (TAER) metric, its importance, calculation methods, and data sources for optimizing airport traffic efficiency. Explore influencing factors and practical examples to improve TAER performance.

Mastering Terminal Arrival Efficiency Rate (TAER) Metrics
E N D
Presentation Transcript
Terminal Arrival Efficiency Rate (TAER) 101 Metric Explanation
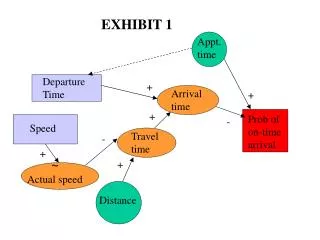
Terminal Arrival Efficiency Rate The TAER was originally designed to measure TRACON performance and the impact of Traffic Management Initiatives (TMI) within 100 miles of the airport. This is not just a measure of the approach control performance, ARTCCs ability to deliver traffic evenly also impacts this measure. How can you influence the TAER? • Holding within 100 miles of the airport • Offloading from one arrival fix to another within 100 miles • Deviating around weather • Vectoring or speed control for spacing • Incorrect runway configurations entered into National Traffic Management Log (NTML) • Metering from ARTCC to Tracon(more consistent traffic feed)
Terminal Arrival Efficiency Rate(Input Data) Each day, input data is received by 0500 for the previous GMT-day from the following sources: Traffic Flow Management System (TFMS): Carrier, flight number, departure and arrival airport, departure (DZ) and arrival (AZ) times, Expected Departure Clearance Time (EDCT), Estimated Time Enroute (ETE). Aeronautical Radio, Inc. (ARINC): Carrier, flight number, leave and arrive airport, Out, Off, On, In (OOOI) times. Circle File from ATO Airspace Lab: Carrier, flight number, departure and arrival airport, latitude and longitude and time at 100 and 40 miles from arrival airport. Runway File: Runway configurations, Airport Arrival Rate (AAR), Airport Departure Rate (ADR), actual arrivals and departures by hour Weather Data: Instrument Approach Conditions (IAC) and Visual Approach Conditions (VAC)
Terminal Arrival Efficiency Rate(Hourly TAER Calculation) Formula: Arrivals For Efficiency Computation The lesser of the Arrival Demand or the Efficiency Airport Arrival Rate Note: TAER cannot exceed 100% Arrivals for Efficiency Computation – TFMS observed arrivals Arrival Demand – how many aircraft wanted to land during each quarter hour. The estimated wheels on time is compared to actual wheels on time to determine the number of quarters of demand for each flight. The following slides will explain how the estimated wheels on time is calculated.A single aircraft may be counted in multiple quarter hours if its expected wheels on time and actual wheels on time differ. Efficiency Airport Arrival Rate – Number of arrivals an airport can support, which is the lesser of the Airport Arrival Rate (AAR) or Ground Delay Program (GDP) rate if one exists. Normally this would be the AAR reported in National Traffic Management Log (NTML), unless a Ground Delay Program (GDP) in effect and then the GDP program rate would be used if less than the AAR.
Terminal Arrival Efficiency Rate(Daily TAER Calculation) Formula: [Sum(hourly TAER * hourly Demand) ]/ [sum(hourly Demand)] Note: TAER cannot exceed 100% The Daily TAER is the sum of the hourly TAER weighted by Demand.
Terminal Arrival Efficiency Rate(Estimated Wheels On Calculation) ATL 40-mile 100-mile For the TAER formula the “Estimated Wheels On Time” is calculated based on: The actual 100-mile circle crossing time, plus the estimated time from the 100-mile boundary crossing point to the 40-mile point plus the unimpeded mean time from the 40-mile point to wheels on These two components will be explained on the next two slides.
Terminal Arrival Efficiency Rate(Estimated Time from 100-mile to 40-mile point) ATL 40-mile 100-mile Estimated time from 100-mile to 40-mile crossing point is the distance divided by the mean speed. Distance - Based on the observed 100 mile crossing point to the nearest 40-mile boundary crossing point Mean Speed –Average speed for the 20% of flights with the shortest distance from 100 to 40, based on 12 months of historical data for combinations of the following categories: : - 40 mile crossing point - Equipment type - Weight class - Meteorological conditions (VAC or IAC) - Runway configuration 42 312 129 227 40 Mile Crossing Point
40-mile Crossing Points The 40 mile crossing points are identified for each airport using CY06 data and revalidated with CY10 data Terminal Arrival Efficiency Rate (Time 40-mile point to wheels on) 312 42 227 129
Terminal Arrival Efficiency Rate (Estimated Time 40-Mile point to wheels on) ATL 40-mile 100-mile The estimated time from 40-miles to wheels on is the unimpeded mean time: Unimpeded Mean Time – The average time for the 20% of flights with the shortest distance from 40 miles to wheels on based on 12 months of historical data for combinations of the following categories: • 40 mile Crossing Point • Equipment type • Weight class • Meteorological conditions (VAC or IAC) - Runway configuration 42 312 129 227 40 Mile Crossing Point
Terminal Arrival Efficiency Rate(Example of how demand is calculated) ATL 40-mile 100-mile Aircraft from ELP to ATL - MD88 Arrival Runway: 26R/27L - IAC Speed from TAER Mean Table: 429 Distance: 61 Est Time 100-40: 8.63 minutes Unimpeded mean time from 40-Wheels On from TAER Mean Table: 15.12 minutes Estimated Wheels On 1341z + 8.63 + 15.12 = 1405z Actual Wheels On: 14:44 Estimated wheels on time is compared to actual wheels on time to determine the number of quarters of demand for that flight. This flight is counted as demand for 3 quarters: 1400z-1414z, 1415z-1429z, & 1430z-1444z 42 312 40 Mile Crossing Point Est Time: 15.12 min 129 227 Distance 61 Speed 429 Est Time: 8.63 min 1341 crossed 100-mile point
Terminal Arrival Efficiency Rate(TAER Hourly Report) TAER calculation: Arrs for Eff / (Arr Demand or EFF AAR), whichever is lower. EFF AAR – based on TMIs in effect, ie. GDP Rates
Terminal Arrival Efficiency Rate(What Happened?) Green dotted line – trajectory used for demand calculation Blue line – actual route of flight
Terminal Arrival Efficiency Rate(TAER Data Issues) Next day, TAER scores are not always accurate due to incomplete data files, i.e. Arrivals for Efficiency and Demand numbers change. • On a next day basis • The ATO Airspace lab is processing data in real time and has not collected and assembled all the flight messages yet. • Actual wheels on times are only available for certain carriers as provided by ARINC. Actual wheels on times for other flights are estimated based on ETMS AZ messages. • 2 days later, additional ETMS records are added and data is reprocessed. TAER scores become more accurate. • 5 days later, all the messages have been collected and properly threaded together. The TAER scores should now be more accurate. • Approximately 40 days after the end of the month, ASQP provides actual wheels on times for additional flights. Actual wheels on times for non-ASQP, non-ARINC flights are still estimated from AZ messages.