Download
1 / 29
290 likes | 409 Vues
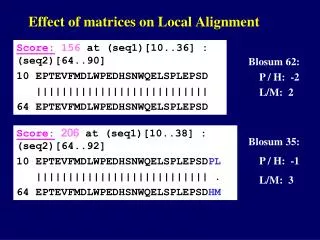
This analysis explores the impact of different scoring matrices (Blosum.62 and Blosum.35) and gap penalties on local alignment scores between protein sequences. Focused on understanding how these factors influence alignment performance, it utilizes sequences from BLAST and Smith-Waterman algorithms to illustrate varying scores under different settings. The evaluation is aimed at providing insights for optimizing homology search strategies for sequence alignment in bioinformatics, highlighting the significance of P-values and E-values in interpreting results.

E N D
Blosum 62: P / H: -2 L/M: 2 Blosum 35: P / H: -1 L/M: 3 Effect of matrices on Local Alignment Score:156 at (seq1)[10..36] : (seq2)[64..90] 10 EPTEVFMDLWPEDHSNWQELSPLEPSD ||||||||||||||||||||||||||| 64 EPTEVFMDLWPEDHSNWQELSPLEPSD Score:206 at (seq1)[10..38] : (seq2)[64..92] 10 EPTEVFMDLWPEDHSNWQELSPLEPSDPL ||||||||||||||||||||||||||| . 64 EPTEVFMDLWPEDHSNWQELSPLEPSDHM
Effect of gap penalty on Local Alignment Blosum 62 Score: 156 at (seq1)[10..36] : (seq2)[64..90] 10 EPTEVFMDLWPEDHSNWQELSPLEPSD ||||||||||||||||||||||||||| 64 EPTEVFMDLWPEDHSNWQELSPLEPSD Gap: -15 Ex: -3 Gap: -5 Ex: - 1 Score: 161 at (seq1)[2..36] : (seq2)[53..90] 2 ASTV----TSCLEPTEVFMDLWPEDHSNWQELSPLEPSD || | | ||||||||||||||||||||||||||| 53 ASSVSVGATEA-EPTEVFMDLWPEDHSNWQELSPLEPSD
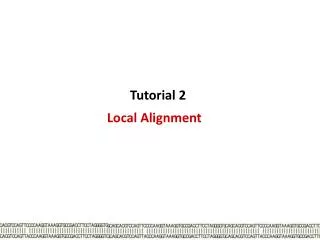
BLAST – Basic Local Alignment Search Tool It is based on local alignment, -- highest score is the only priority in terms of finding alignment match. -- determined by scoring matrix, gap penalty It is optimized for searching large data set instead of finding the best alignment for two sequences
BLAST – Basic Local Alignment Search Tool The P and E value for HSP(s) : based on the total score (S) of the identified “best” local alignment. P (S) : the probability that two random sequence, one the length of the query and the other the entire length of the database, could achieve the score S. E (S) : The expectation of observing a score >= S in the target database. For a given database, there is a one to one correspondence between S and E(s) -- choosing E determines cut off score
1.) Where should I search? Overview of homology search strategy • NCBI • Has pretty much every thing that has been available for some time • Genome projects • Has the updated information (DNA sequence as well as analysis result)
2.) Which sequence should I use as the query? • Protein • cDNA • Genomic Overview of homology search strategy Practice: identify potential orthologs using either cDNA or protein sequence. Test
2.) Which sequence should I use as the query? cDNA (BlastN) Overview of homology search strategy Protein (TblastN)
Base level identity Protein: 100% Protein: ~ 5% Nucleotide: 33% Nucleotide: ~ 25% 2.) Which sequence should I use as the query? Protein v.s cDNA Overview of homology search strategy query: S A L query: TCT GCA TTG target: S A L target: AGC GCT CTA Searching at the protein level is much more sensitive
2.) Which sequence should I use as the query? Overview of homology search strategy If you want to identify similar feature at the DNA level. Be Cautious with genomic sequence initiated search • Low complexity region • repeats
3.) Which data set should I search? • Protein sequence (known and predicted) blastP, Smith_Waterman • Genomic sequence • TblastN • EST • TblastN • Predicted genes • TblastN Overview of homology search strategy
4.) How to optimize the search ? Overview of homology search strategy • Scoring matrices • Gap penalty • Expectation / cut off Example
5.) How do I judge the significance of the match ? Overview of homology search strategy • P-value, E -value • Alignment • Structural / Function information
6.) How do I retrieve related information about the hit(s) ? Overview of homology search strategy • NCBI is relatively easy • The scope of information collection can be enlarged by searching (linking) multiple databases (links). example • genome projects often have their own interface and logistics (ie. Ensemble, wormbase, MGI, etc. )
Situations where generic scoring matrix is not suitable • Short exact match • Specific patterns
Why a BLAST match is refused by the family ? Position –specific information about conserved domains is IGNORED in single sequence –initiated search BID_MOUSESESQEEIIHN IARHLAQIGDEM DHNIQPTLVR BAD_MOUSE APPNLWAAQR YGRELRRMSDEF EGSFKGLPRP BAK_MOUSE PLEPNSILGQ VGRQLALIGDDI NRRYDTEFQN BAXB_HUMAN PVPQDASTKK LSECLKRIGDEL DSNMELQRMI BimS EPEDLRPEIR IAQELRRIGDEF NETYTRRVFA HRK_HUMAN LGLRSSAAQL TAARLKALGDEL HQRTMWRRRA Egl-1 DSEISSIGYE IGSKLAAMCDDFDAQMMSYSAH BID_MOUSESESQEEIIHN IARHLAQIGDEM DHNIQPTLVR sequence XSESSSELLHN SAGHAAQLFDSM RLDIGSTAHR sequence Y PGLKSSAANI LSQQLKGIGDDL HQRMMSYSAH
DNA pattern – Transcription factor binding site. Short protein pattern – enzyme recognition sites. Protein motif/signature. Specific patterns
Examples: Binary patterns for protein and DNA • Caspase recognition site: • [EDQN] X [^RKH] D [ASP] Observe: Search for potential caspase recognition sites with BaGua
G R C W G R C W G R C W G A C A G T G A C A G T G A C A G T Seq: A G G G C T C A T G A C A Searching for binary (string) patterns Positive match
Does binary pattern conveys all the information ? • Weighted matrix / profile • HMM model For searching protein domains
What determine a protein family? • Structural similarity • Functional conservation
Practice: motif analysis of protein sequence using ScanProsite and Pfam • Open two taps for Pfam, input one of the Blast hits and one candidate TNF to each data window. • Compare the results
Scan protein for identified motifs • A service provided by major motif databases such as Prosite,, Pfam, Block, etc. • Protein family signature motif often indicates structural and function property. • High frequency motifs may only have suggestive value.
What is the possible function of my protein?Which family my protein belongs to? -- Profile databases • Pfam (http://pfam.wustl.edu/ ) • Prosite (http://us.expasy.org/prosite/ ) • IntePro (http://www.ebi.ac.uk/interpro/index.html ) • Prints (http://bioinf.man.ac.uk/dbbrowser/PRINTS/PRINTS.html )
Protein motif /domain • Structural unit • Functional unit • Signature of protein family How are they defined?
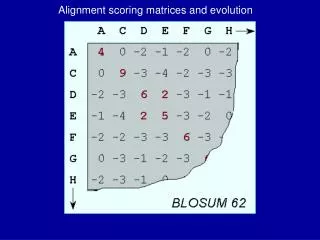
[GSC] [HEQCRK] X [^ILMFV] L Basic concept of motif identification 2. How do we represent the position specific preference ? BID_MOUSEI A R H L A Q I G D E M BAD_MOUSE Y G R E L R R M S D E F BAK_MOUSE V G R Q L A L I G D D I BAXB_HUMAN L S E C L K R I G D E L BimS I A Q E L R R I G D E F HRK_HUMAN T A A R L K A L G D E L Egl-1 I G S K L A A M C D D F Binary pattern:
G: 5 -> 71% S: 1 -> 14 % C: 1 -> 14 % Basic concept of motif identification 2. How do we represent the position specific preference ? BID_MOUSEI A R H L A Q I G D E M BAD_MOUSE Y G R E L R R M S D E F BAK_MOUSE V G R Q L A L I G D D I BAXB_HUMAN L S E C L K R I G D E L BimS I A Q E L R R I G D E F HRK_HUMAN T A A R L K A L G D E L Egl-1 I G S K L A A M C D D F Statistical representation
Scoring sequence based on Model Seq: A S L D E L G D E 1 2 3 4 A 1 0-4 . C 2 5-1 . D 1-3 9 . … . . . . score @ position_1 = s(A/1) + s(S/2) + s(L/3) + s(D / 4) An example of position specific matrix
Binary patterns: Representation of positional information in specific motif M-C-N-S-S-C-[MV]-G-G-M-N-R-R. Positional matrix: -2.499 -2.269 -5.001 -4.568 -2.418 -4.589 -3.879 1.971 -4.330 1.477 -1.241 -4.221 -4.590 -4.097 -4.293 -3.808 0.495 2.545 -3.648 -3.265 1.627 -2.453 -1.804 -1.746 -3.528 2.539 1.544 -3.362 -1.440 -3.391 -2.490 -1.435 -3.076 -1.571 0.501 0.201 -1.930 -2.707 -3.473 -3.024 -1.346 -2.872 -1.367 0.699 -2.938 -2.427 -0.936 -2.632 -0.095 1.147 -1.684 -1.111 -2.531 1.174 2.105 1.057 -1.400 -2.255 -2.899 -2.260 1.045 1.754 -1.169 -0.576 -2.756 -2.212 1.686 -2.576 0.951 -2.438 -1.544 0.857 -2.301 1.891 1.556 -1.097 -1.180 -2.155 -2.751 -2.060 -3.385 -2.965 -5.039 -4.313 -1.529 -5.006 -3.577 0.429 -4.094 3.154 -0.121 -4.440 -4.199 -3.292 -3.662 -4.198 -3.281 -1.505 -3.043 -3.120 2.368 -3.197 -2.285 -1.533 -3.721 -2.945 1.815 -3.235 0.067 -3.061 -2.259 -1.680 -3.231 1.195 2.287 -2.009 -2.044 -2.825 -3.324 -2.844 1.046 1.742 0.576 -0.734 -2.072 -2.234 -0.851 0.436 -0.548 -0.129 -0.974 -1.039 -2.318 2.368 0.667 -1.135 -1.076 -1.304 -2.398 -1.821 0.715 -1.778 -3.820 -3.359 -1.535 -3.463 -2.571 3.060 -3.008 0.262 1.566 -2.996 -3.575 0.450 -3.001 -2.571 -1.765 0.193 -2.389 -2.068 -2.053 0.965 -2.767 -3.509 -4.520 3.654 -3.242 -4.548 -3.338 -4.968 -3.789 -2.462 -4.048 -3.738 -3.266 -2.596 -3.573 -3.990