Download
1 / 17
190 likes | 216 Vues
Understand profit maximization, market failure, and achieving economic efficiency in transportation services. Learn how to determine profit-maximizing positions using marginal cost and revenue analysis. Explore scenarios of profit or loss in transport operations.

E N D
Perfect competition in transport markets By Immanuel Nashivela TEC711S
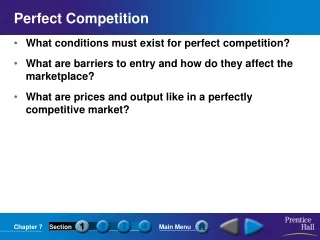
Unit outline On reading this chapter, you will learn: • The theory of the firm • The position of profit maximisation for the provider of transport services • The underlying conditions required in order to ensure that competitive pressures on transport operators are maximised • That such a level of ‘maximum’ competition ensures that economic efficiency is attained in the provision of transport services • A formal definition for what constitutes ‘market failure’ in transport markets
PROFIT MAXIMISATION • Profit maximisation is said to occur at that level of output • where: Marginal Cost (MC) = Marginal Revenue (MR) • marginal cost is defined as the ‘rate of increase in costs with respect to output’ (the cost of the last unit produced). E.g. for a bus company the cost of the last person carried. • Marginal revenue - additional total revenue gained by selling one more unit(per time period). E.g. how much the last person on the bus paid for their journey? • Marginal revenue is the difference in total revenue per time period as a result of cutting the price in order to carry one extra passenger, and thus includes the possibility of a negative value when market demand is inelastic • Marginal revenue will always be lower than average revenue as the firm must reduce the fare in order to increase patronage, even if this is only by one
Marginal and average revenue curves • the demand curve has also been labelled as the average revenue curve (AR), because if the firm sells say 100 units at £5 each the average revenue gained for each unit is simply the price of £5. • Notice also that the marginal revenue curve is twice as steep as the average revenue curve and thus at all levels of output, as explained above, marginal revenue is always less than average revenue.
As output rises marginal costs rise and marginal revenue falls • This is because if the firm wants to sell more it needs to always lower its price, hence falling marginal revenue, whilst increasing output will have rising marginal costs over most of the range of output • For output level Q1 marginal revenue is greater than marginal cost. • in order to increase total profit the firm should actually increase production • Moving to point b, however, at the level of production Q2 marginal cost is greater than marginal revenue. In this case, the last unit sold cost more to produce than the revenue which it generated, • The firm should reduce production and not produce that last unit, as this will increase total profit but reduce MR • It should continue to reduce production until marginal cost equals marginal revenue • Because marginal costs and marginal revenue move in opposite directions with the level of output there will always be a point of convergence and it is at that point where profits are maximised which is at point C
In order to determine the actual level of profits (or indeed losses) incurred by the firm at the profit maximising position, the demand and average cost curves need to be added to the figure Profit maximising position for the firm • The prevailing market conditions allow a fare of P to be charged, as shown by point c • The average cost of each passenger carried is found at point b • Total revenue is therefore given by the area outlined by 0, P, c, Q and total costs by the area outlined by 0, AC, b, Q • The net difference, i.e. the area AC, P, c, b, is the profit, or to be more exact the abnormal profit
It is also useful, certainly in the context of transport operations, to consider that the profit maximising position need not necessarily produce a profit • Transport service often prevails in this diagram below. Losses at the ‘profit’ maximising position of the firm • The ‘profit’ maximising position is found at point a where marginal cost equals marginal revenue. • The associated average cost of each passenger carried is again found at point b • The fare that can be charged is found at point c on the demand curve, giving a fare of P
As can be clearly seen, the fare paid by each passenger is less than the cost to the operator of providing the resources for that journey, thus in this case the company is making a loss. • In the short run, as long as the firm is covering its variable costs, in most cases it will continue in operation until the capital is life expired, at which point it will close down • This is particularly the case where services are provided on equity grounds, such as those deemed to be social necessities in which the total revenue gained from the passenger will never cover the costs of providing the service. • Subsidy is thus required in order to allow production of the service and bridge the gap between costs and revenue
PERFECT COMPETITION • perfect competition is one of the major requirements in order to achieve allocative efficiency • perfect competition is seen as a highly competitive market where competition itself ‘regulates’ the market and ensures economic efficiency is achieved • Basic Conditions or Assumptions of Perfect Competition • Freedom of entry and exit • Homogeneous product • High number of buyers and sellers • Perfect information. • Perfect competition is simply a ‘benchmark’ to be used to compare an ideal with reality to allow market failures to be identified • market failure occurs when one of the assumptions of perfect competition is breached and hence the market does not achieve economic efficiency
Perfect competition, short run position (profits • The demand curve facing the individual firm is perfectly elastic, i.e. horizontal at price PSR, due to perfect substitutability between rival services • Note: under the conditions of perfect competition, average revenue equals marginal revenue AR=MR • The market sets its price at PSR and due to a high number of buyers and sellers the firm is a price taker. • As normal the firm is assumed to be a profit maximiser, hence produces where MC = MR, highlighted by QSR for the individual firm • The firm is making abnormal profits, shown by the cross hatched area ACSR, a, b, PSR,
This effect of new firms entering the market is shown below as a result the supply curve has shifted to the right. The market price therefore falls to PLR. Perfect competition, the long run position • The individual firm adjusts its level of output to the new profit maximising position, which is now at QLR. • Note the firm is producing at the lowest point on the long-run average cost curve, hence productive efficiency is ensured (MES) • which means it is covering all its costs including the cost of capital • the abnormal profits that were being made in the short run have now been ‘transferred’ to the consumer in the form of lower prices • It is for these reasons that perfect competition is said to be the most economically efficient market structure
MARKET FAILURE • In regards to market failure all the following assumptions must exist or else the market could be regarded as a failed market ; • All firms are profit maximisers • All consumers are utility maximisers • Perfect information • Homogeneous product • Many buyers and sellers • No barriers to entry or exit • Further Assumptions: • Non increasing production technologies, thus there are no economies of scale • Non rivalry in consumption - consumption by one individual does not preclude consumption by another • Absence of externalities, all benefits and costs are private and thus taken into account in market based decisions • No government intervention to ‘interfere’ between the forces of demand and supply
Exercise 6.1 Perfect competition in bus markets • If we assume that a given bus market is in perfect competition which charges a flat fare of £1, and if the formula for the total demand (in thousands) in the market is given by the equation: • Qd = 250 − 60P Where Qd is the quantity demanded in thousands at a given price P. If we further assume constant returns to scale, then: a) What is the total market demand at the £1 flat fare? b) If the market is shared equally by 4 firms, what is the number of passengers carried by each company? c) If the cost per vehicle kilometre is £1.60, average utilisation 20 passengers per vehicle kilometre and average trip distance 10 kilometres:2 i What is the level of bus kilometres required to service this market? ii What profits are being made? iii What type of profit is this, normal or abnormal? iv What is the cost per passenger carried (as opposed to the cost per vehicle kilometre)?
d) As this is perfect competition, new firms may enter the market and compete these profits away. What price therefore will ensure that only normal profits are made? e) The answer to part d should be the same as the answer to c(iv), why? f) At the lower flat fare, why has market efficiency now been achieved? g) This exercise assumes that the four firms in the market will behave consistent with the perfect competition model, however is that in their own best interests? What does this tell us about market structures where only a few firms exist? h) Why in this exercise however would the firms be forced to behave consistent with the perfectly competitive market?
Exercise 6.1 Perfect competition in bus markets • Qd= 250 − 60P • What is the total market demand at the £1 flat fare? Qd = 250-60(1) = 190, 000 b) If the market is shared equally by 4 firms, what is the number of passengers carried by each company? 190/4 = 47,500 passengers c) If the cost per vehicle kilometre is £1.60, average utilisation 20 passengers per vehicle kilometre and average trip distance 10 kilometres: i What is the level of bus kilometres required to service this market? 190000/20 = 9500 km 9500 km/4=2375km by each bus ii What profits are being made? =TR-C and TR = P x Q, TR = £1 x 190,000 =£190,000 TC = 9500 x £1.6 = £15200 = £190,000 – £15200 = £174800 iii What type of profit is this, normal or abnormal? = Abnormal iv What is the cost per passenger carried (as opposed to the cost per vehicle kilometre)? • £15200/190,000 = £0.08
d) As this is perfect competition, new firms may enter the market and compete these profits away. What price therefore will ensure that only normal profits are made? = R – C , 0 = P x 190,000 -15200 = 15.2/190 = Px190/190 = £0.08 e) The answer to part d should be the same as the answer to c(iv), why? Perfect competition AC= AR = P and a profit of 0 • At the lower flat fare, why has market efficiency now been achieved? Bus (firms) are producing at minimum cost g) This exercise assumes that the four firms in the market will behave consistent with the perfect competition model, however is that in their own best interests? What does this tell us about market structures where only a few firms exist? No, they can collude and fix the price h) Why in this exercise however would the firms be forced to behave consistent with the perfectly competitive market? Because of limited demand