Download
1 / 41
420 likes | 596 Vues
Biomonitoring air toxics using lichens. Linda Geiser, US Dept. of Agriculture-Forest Service, Pacific Northwest Region Air Resource Management, PO Box 1148, Corvallis OR 97330. Examples from US national forests in northwestern North America. What are lichens?.

E N D
Biomonitoring air toxics using lichens. Linda Geiser, US Dept. of Agriculture-Forest Service, Pacific Northwest Region Air Resource Management, PO Box 1148, Corvallis OR 97330 Examples from US national forests in northwestern North America
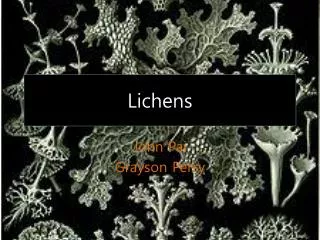
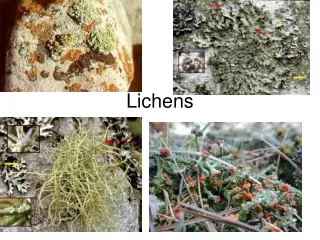
What are lichens? Lichens are dual organisms consisting of a fungus and an alga+/or cyanobacterium. British soldiers Button lichen Lung lichen
What physiological properties make lichens useful indicators of air quality? • High surface area and no roots. Epiphytic lichens obtain nutrients from the air, precipitation, and substrate run-off. Tissue levels of many pollutants are correlated with ambient atmospheric levels. • Readily absorb water and lack specialized barriers to prevent vapor loss. Daily cycles of wetting and drying produce a dynamic equilibrium between concentration and leaching of pollutants. As pollution concentrations change, so do concentrations in lichens. Mobile elements: S, N, K, Ca, Mg, Na. – can change significantly over a few months. Less mobile elements: Pb, Cd, Ni—change more slowly. • Range of air pollution sensitivities across species. Lichens exhibit a range of sensitivities to S & N containing acid rain, sulfur dioxide, ammonia, and fluoride. The most sensitive lichens serve as the “canary” for other organisms and the ecosystem. The mix of species and abundances at any one site can be used to position the site along an air quality gradient.
Lichen monitoring methods used by the US Forest Service • Tissue analysis • Community analysis* * Not covered in this presentation
Tissue analysis • The best target species are pollution tolerant, abundant, large, and broadly distributed. • Baselines should be established over 3-4 years. • To reduce within-site variation and obtain a precise estimate of contaminant means for a site, samples must contain many individuals (20 g dw from 6+ subsamples). Check within-site variation by collecting 2-4 replicate samples/site. • Random selection of sites important to make generalizations to larger study area. • Analysis of multiple pollutants detects unsuspected pollutants and is useful for source apportionment. • QC is important! Keep training, field, and lab methods constant. Use consistent system of stds & duplicates to track lab precision/accuracy within batches and between batches from different years. • USFS Pacific NW Air Resources protocols at (http://www.fs.fed/r6/aq/lichen).
#1. Establishing clean site ranges and delineating geographic areas of concernAlaska andPacific Northwest Regions Red dots indicate monitoring locations where lichen community surveys and tissue analysis has been completed by the USFS Air program. In PNW forests, lichen work is co-located with the CVS (=FIA) grid.
Pacific Northwest and Alaska Regions Values for most elements had similar ranges across a wide geographic and climatic gradient: from wet, low, cool coastal forests (SIU) to dry, continental forests with wide temperature extremes (DES). Means from urban areas (URB), the Willamette Valley (VAL) and the Columbia River Gorge NSA (CRGNSA) were significantly higher. REFERENCE: See http://www.fs.fed.us/r6/aq for provisional clean site ranges.
Pacific Northwest and Alaska Regions Platismatia glauca • For management purposes, we need a line– what range is typical of clean sites? Above what value should tissue concentrations be considered elevated? • Created clean sites database by removing plots overlapping roads and campgrounds, urban plots, the Mt St Helens ash deposition area, the Columbia River Gorge, and national forest plots adjacent to the CRG Distribution of sulfur concentrations for one lichen over the entire study area
Pacific Northwest and Alaska Regions Platismatia glauca element profiles, CLEAN SITES ONLY, in Oregon and Washington. n = 250. 97.5% quantiles are being used for clean site thresholds.
Pacific Northwest and Alaska Regions Biological data supported statistically selected thresholds : • The Regions’ twelve lichen species most sensitive to sulfur and nitrogen deposition did not occur at sites where tissue concentrations of nitrogen and sulfur were above the 97.5% quantiles for the clean site database. *Maximum concentration of S or N (% dry weight) observed in the lichen, Platismatia glauca, where population size of the rated species >40 individuals/acre.
Pacific Northwest and Alaska Regions Lead Examples of maps that can be made using element thresholds. Red dots indicate elevated sites.
Pacific Northwest and Alaska Regions Chromium
#2. Check a site within an area with established background ranges. Klondike Gold Rush National Historic Park, Skagway, Alaska REFERENCE: Furbish, C.E., L.H. Geiser and C. Rector. 2000. Lichen-air quality pilot study for Klondike Gold Rush National Historical Park and the City of Skqaway, Alaska. Klondike Gold Rush National Historical Park Natural Resources Management Program. Report released December 2000.
Klondike Gold Rush National Historic Park, Skagway, Alaska Mean concentrations of Al, Cd, Cr, Cu, Fe, Pb, Ni, P, K, S, Zn in the lichen, Hypogymnia enteromorpha, were higher in Klondike Gold Rush NHP samples than Tongass National Forest samples. Pb S Zn
Klondike Gold Rush National Historic Park, Skagway, Alaska x 10 Mean concentrations of Cd, Cr, Cu, Fe, Pb, Ni, S, Zn in all three lichen species collected at Dewey, closest to the city harbor, were higher than provisional PNW background thresholds. (Here, H. enteromorpha).
#3. Mapping deposition patterns from a point source. Tongass National Forest, Sitka, Alaska REFERENCE:Geiser, LH/ Derr, CC/ Dillman, KL 1994: Air Quality Monitoring on the Tongass National Forest. Methods and Baselines Using Lichens. - USDA-Forest Service, Alaska Region Technical Bulletin 46. 85 pp.
Tongass National Forest, Sitka, Alaska Typical cover of lichens on alder in the Sitka area Lichens were absent from alder <0 .25 mi from the pulp mill
3-D view of lichen tissue concentrations in # of sd from Tongass clean sites mean (vertical axis) vs sampling site location (horizontal axes). Far right is < 1km from the pulp mill, center is Sitka city center, far left is the ferry terminal, 14 mi distant. Tongass National Forest, Sitka, Alaska
#4. Documenting deposition of pollutants in a Class 1 Area and tracing their source. Mt. Zirkel Wilderness, Routt NF, Colorado REFERENCE: Jackson, LL, L Geiser, T Blett, C Gries, D Haddow. 1996: Biogeochemistry of lichens and mosses in and near Mt. Zirkel wilderness, Routt National Forest, Colorado: influences of coal-fired power plant emissions. - Open-File Report, 96-295, U.S. Department of the Interior, U.S. Geological Survey. 162 pp.
Mt. Zirkel Wilderness, Routt NF, Colorado • The Hayden and Craig plants of Yampa Valley, Colorado, together emited22,000 tons of SO2, 27,000 tons of nitrogen oxides and 2,400 tons of particulates--the greatest point sources of these pollutants in NW Colorado. • Studies of lake and snow chemistry were highly suggestive that the power plants contributed to higher levels of acidity in the Mt. Zirkel Wilderness. Used lichen monitoring to detect pollutants in terrestrial ecosystems and trace their source.
Mt. Zirkel Wilderness, Routt NF, Colorado Mean % Sulfur and % nitrogen in the rock lichen, Xanthoparmelia cumberlandia, from Mt. Zirkel Wilderness were significantly higher than comparison sites in the central Rocky Mountains.
Mt. Zirkel Wilderness, Routt NF, Colorado Stable S isotope ratios in lichens were significantly heavier in the MZW and Routt NF than at regional sites. This was consistent with a local sulfur source with a heavy isotopic signature such as would derive from the combustion of many of the marine-influenced coals in the Yampa Valley.
#5. Estimating deposition from calibrated lichen data. Pacific Northwest National Forests Lichen tissue collections were made within 1 km of 8 NADP monitors in Oregon and Washington (black dots on national map above).
Pacific Northwest National Forests Lichen sulfur concentrations, weighted by precipitation, accurately predicted wet deposition of sulfur to within about 0.3 kg/ha/yr. SO4 deposition (kg/ha/year) = -0.2474 + 0.43263 Lichen % S (precipitation weighted) R2 = 0.876043 Prob >F = 0.0002
Pacific Northwest National Forests A map of wet deposition of sulfur in Pacific NW national forests constructed using calibrated lichen data. A map of wet deposition of nitrogen looked similar.
# 6. Radioactive Fallout: What patterns and amounts in coastal NW N America? • Lichens accumulate 137Cs and are used to assess radioactive fallout. • How much radioactivity exists in lichens and soils of NW N America and how does it compare to past levels? • During 1998, in partnership with biologists and radiochemists at the NPS, UA-Fairbanks, Texas A&M, and OSU, we measured Cs137 levels in arctic-alpine lichens along a latitudinal transect from the Mt. Hood Wilderness north through the Tongass N.F., Anchorage, Bering Land Bridge NP and Cape Krusenstern NM.
Coastal NW North America 1. Arctic Cs137 activities were low. Samples from the Mt. Hood Wilderness and Tongass NF-Stikine Area had highest activities. Data from the caribou lichen, Cladina rangiferina
Coastal NW North America 2. Activity decreased with increasing latitude and decreasing elevation (precip).
Coastal NW North America 3.Compared to Canadian measurements 10 years ago, Cs137 activities were lower in the northern latitudes and higher in the southern latitudes Comparison of 137Cs activities in Cladina rangiferina from coastal northwest North America in 1998 (large squares, green line) to central Canada in 1980 (Benson-Hutchinson, et al.) (small squares, red line).
Coastal NW North America • On average, Cs137 activities were higher in soils than in lichens. Highest activities were found in histosols of the Tongass N.F. Lowest activities were found in sands of Mt. Hood Wilderness and on the Seward Peninsula.
Coastal NW North America • Most of the 137Cs in our atmosphere was released during above-ground nuclear weapons testing during the 1950’s and 1960’s. • 137Cs is distributed globally and fall-out concentrations are usually highest in the middle latitudes of the northern hemisphere. After an incident, most of the material is deposited on vegetation, soils and surface waters within a few years. • Continued deposition is affected by factors such as rainfall, elevation, aerosol concentration, particle size distribution, and location of the jet stream. High precipitation/high elevation areas under the jet stream, including coastal Oregon, Washington, British Columbia and southeastern Alaska receive differential deposition. • In lichens, variability of 137Cs activity between sites is also affected by growth rates, leaching rates and grazing. In soils, retention and biological turnover is affected by soil type, hydrology and average temperatures. • Even though above ground nuclear testing ended more than 30 years ago, and despite biological turnover, much of the radioactive material released into the atmosphere is still present in our soils and vegetation.
# 7. Detecting and comparing levels of persistent organochlorines.Pacific Rim Air Toxics Study Two lichens and two mosses were analyzed for persistent organic pollutants and metals at sites around the Pacific Rim (red pinpoints above).
Pacific Rim • Lichens: Cetraria islandica, Flavocetraria cucullata; Mosses: Hylacomium splendens, Racomitrium lanuginosum. 4 reps/site • GC-MS for unequivocal ID of analytes. Negative chemical ionization mode lowers detection limits. $1000/sample. • Forty pesticides and PCBs tested : HCH, heptachlor, aldrin, chlordane, endosulfan, dieldrin, DDE/D/T, endrin, PCBs 8-209. Half of all samples detected at < 0.1 ng/g, 13 > 0.4 ng/g dw. • Levels were low. DDT highest on Willamette NF (1 ppb). PCBs highest in SEAK and Kamchatka (5-6ppb)
Pacific Rim • Low concentrations and interference from natural secondary substances in lichens made analyses difficult. • Values from these sites will be compared to the larger database from the Arctic Research Contaminants program to examine latitudinal trends.
Summary: Advantages of lichen monitoring ØGood indicators of deposition containing sulfur, nitrogen, metals, other elements, radionuclides and some hydrocarbons/organochlorines. ØDemonstrates presence of contaminants in the ecosystem. • Relatively fast and inexpensive—many measuring points can be made in a short time that summarizing air quality over past months or years. ØUseful in areas of rugged topography where modeling is inadequate. ØUseful in remote areas—does not require electric power. ØCan be used to map relative differences in air quality over a geographical area of interest and to track changes over time. If air pollution tolerant species are used, can map polluted areas. ØCompliments instrument measurements and other monitoring information. Element analyses, community analyses used in combination with direct measurements or other bioindicatorscan corroborate each other, making a more convincing argument for decision-makers.
Summary: Advantages of lichen monitoring • Source apportionment is possible using multi-element analysis and isotope ratios. • Plentiful existing data for the PNW and Alaska and Canada for metals, and in arctic for POPs, some data for radionuclides from Canada. Preliminary thresholds for metals. • Can link to existing programs: FHM (lichen communities) and USFS-PNW (communities and tissue analysis). • Not mobile, concentrations reflect local conditions. • Easy to collect, lichens are widespread and easy to recognize. • Deposition can be estimated from lichen tissue levels if instrumented sites are available for calibration. • Multi-element analysis can evaluate multiple stressors simultaneously, good idea to measure effects of sulfur and nitrogen deposition together with other pollutants.
Summary: Limitations of lichen monitoring • Lichens are relatively insensitive to many air toxics (metals, radionuclides, organics)– lichen communities affected more by acid rain, SO2, N deposition and fluorine. I.e. may be able to show presence or levels but not adverse effects to ecosystem. • Some metals are not easily leached from lichen thalli and may remain concentrated for 10+ years. Can use transplants, select species with annual growth (Hylacomium splendens) or collect from substrate of known age (last five terminal bud scars). Or, because epiphytic lichens grow rather quickly, can monitor changes over time of the population mean. • Interference from local dust: use enrichment factor from local soils (Al). • Tissue analysis cannot differentiate wet from dry deposition. May not be able to distinguish different forms of a single element.
Summary: Limitations of lichen monitoring • To obtain accurate and repeatable readings of metals, tissue concentrations of metals should be in the 0.1 ppm range or higher. Check detection limits of laboratory before analysis. • Lichen analysis for POPs is analytically challenging because concentrations are usually low and natural lichen substance interfere with analyses. But much base work has been completed for the arctic. • Must have sufficient material– lichens may be difficult to find where acid rain, SO2 or N deposition is a problem. Can use transplants. Must compare different sites using the same species. • Regulatory personnel are often unfamiliar with lichen monitoring methods. Can establish LACs, develop an MOU, or calibrate data to units used by regulatory agencies.
Web Resources • American Bryological and Lichenological Society http://www.abls.org • USDA-Forest Service Air Resource Management Program http://www.fs.fed.us/r6/aq/lichen • Search Recent Literature http://www.toyen.uio.no/botanisk/bot-mus/lav/sok_rll.htm • Northwest Lichenologists http://www.nwlichens.org • Forest Inventory Analysis—Lichen Indicator http://www.wmrs.edu/lichen/