Download
1 / 31
330 likes | 486 Vues
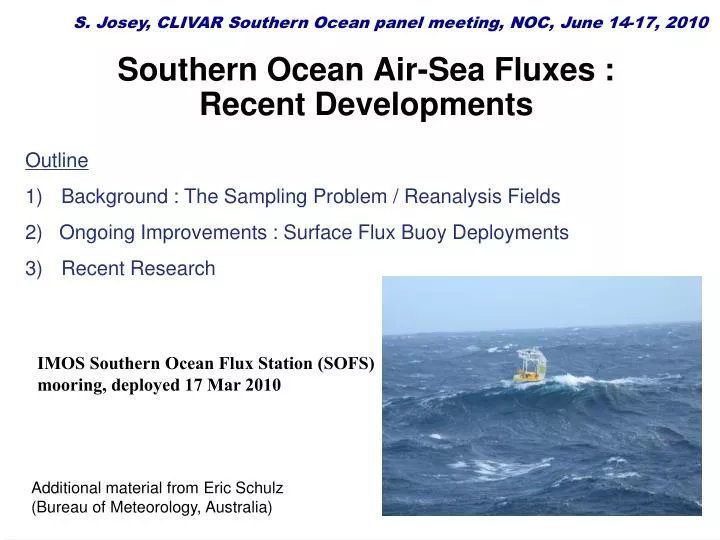
Southern Ocean Air-Sea Fluxes : Recent Developments. S. Josey, CLIVAR Southern Ocean panel meeting, NOC, June 14-17, 2010. Outline Background : The Sampling Problem / Reanalysis Fields. 2) Ongoing Improvements : Surface Flux Buoy Deployments 3) Recent Research.

E N D
Southern Ocean Air-Sea Fluxes : Recent Developments S. Josey, CLIVAR Southern Ocean panel meeting, NOC, June 14-17, 2010 Outline Background : The Sampling Problem / Reanalysis Fields 2) Ongoing Improvements : Surface Flux Buoy Deployments 3) Recent Research IMOS Southern Ocean Flux Station (SOFS) mooring, deployed 17 Mar 2010 Additional material from Eric Schulz (Bureau of Meteorology, Australia)
Components of the Air-Sea Heat Exchange Shortwave 129 Latent -65 • Example values from the NCEP/NCAR reanalysis at the SOFS mooring site …. Longwave -57 Sensible -12 Net heat flux = -5 Wm-2 NCEP Climatological Annual mean (46.75 S, 142 E) values - Wm-2 • Southern Ocean : Annual mean heat exchange close to zero - unclear whether ocean gains or loses heat over much of region (dataset dependent). • Strong seasonal variation. Net heat flux = -5 Wm-2
The Southern Ocean Sampling Problem • Attempts to estimate air-sea exchanges in Southern Ocean are plagued by lack of observations. All available flux fields have significant sampling problems including reanalyses . • SST coverage from ships / floats reasonable (?)…. All July Latent Obs. 2000-2004 • However, latent heat flux requires wind speed, air temperature and humidity as well. • Some coverage in summer, virtually nothing in winter.
The Southern Ocean Sampling Problem • Attempts to estimate air-sea exchanges in Southern Ocean are plagued by lack of observations. All available flux fields have significant sampling problems including reanalyses . • SST coverage from ships / floats reasonable (?)…. All July Latent Obs. 2000-2004 • However, latent heat flux requires wind speed, air temperature and humidity as well. • Some coverage in summer, virtually nothing in winter. • New surface flux moorings offer potential for accurate evaluation of reanalysis fields at specific locations … results may be more widely applicable. x ★ SOFS mooring (46.75 S, 142 E) Planned Japanese mooring (60 S, 140 E)
Flux Datasets • Atmospheric Reanalyses : • Assimilate various data types and potentially useful if model physics reliable. Employed in studies of variability (e.g. SAM, Ciasto and Thompson, 2007). • Only dataset class suitable for forcing ocean models. • Satellite Observations : • SST and wind speed readily available. However, near surface humidity and air temperature also required to estimate latent and sensible heat fluxes. • Reanalyses / Satellite Synthesis : • OAFLUX (Yu and Weller, 2007). • Need for assessment of whether satellite observations and reanalyses can provide reliable flux estimates … Dong et al. (2010).
Heat Exchange According to NCEP… • Heat flux field shows some variation in heat gain / loss according to sector considered. • Set to some extent by variations in sea-air temp difference… 1.5 80 -80 -1.5 NCEP Annual Mean Net Air-Sea Heat Flux (Red - ocean heat gain, W m-2) NCEP Annual Mean Sea-Air Temperature (Red - ocean warmer than atmosphere, deg C)
Seasonal Cycle : Extremes Of course, annual mean field never actually occurs. Instead we have strong seasonal variation … Balance between latent / sensible / longwave heat loss and shortwave gain. 200 -200 NCEP - January Mean Net Heat Flux (W m-2) NCEP - July Mean Net Heat Flux (W m-2)
Comparison with ECMWF Reanalysis NCEP and ECMWF show similar variation in Southern Ocean… NCEP / NCAR Net Air-Sea Heat Flux (W m-2) ECMWF Net Air-Sea Heat Flux (W m-2)
The Centre for Australian Weather and Climate Research A partnership between CSIRO and the Bureau of Meteorology Eric Schulz Web: www.cawcr.gov.au A Meteorological Buoy in the Southern Ocean for Weather and Climate Studies www.cawcr.gov.au
Where The Centre for Australian Weather and Climate Research A partnership between CSIRO and the Bureau of Meteorology Southern Ocean Flux Station (SOFS) Funded by IMOS. Bureau owned and operated with support from CSIRO 46.75oS, 142oE 350 NM SW of Tasmania Sub-Arctic Zone with strong biological activity Eric Schulz, Web: www.cawcr.gov.au
SOFS Specifications • Meteorological buoy • large surface float • Instrument tower • Slack line (with chain wire and synthetic rope), 1.35 scope, 4km watch radius • Acoustic releases, buoyancy • Anchor (3.5 t) • 4.6 km water depth • Real-time data telemetry (hourly obs) • Wind • Temperature • Humidity • Pressure • Solar and IR radiation • Precipitation The Centre for Australian Weather and Climate ResearchA partnership between CSIRO and the Bureau of Meteorology
Tower and Well 2.7m 1.5m The Centre for Australian Weather and Climate ResearchA partnership between CSIRO and the Bureau of Meteorology
SOFS Tower and instruments Wind Short- & Long-wave radiation Temperature & Humidity Precipitation Air pressure The Centre for Australian Weather and Climate ResearchA partnership between CSIRO and the Bureau of Meteorology
Deployed 17th March 2010… The Centre for Australian Weather and Climate ResearchA partnership between CSIRO and the Bureau of Meteorology
Example Observations: hourly averages, telemetered 6 x daily, dual observations Wind Speed Wind Direction Pressure The Centre for Australian Weather and Climate ResearchA partnership between CSIRO and the Bureau of Meteorology
Example observations Shortwave Longwave Precip The Centre for Australian Weather and Climate ResearchA partnership between CSIRO and the Bureau of Meteorology
ACCESS Model Evaluation – SW Radiation Eric Schulz – Preliminary evaluation of Bureau's ACCESS model (UK Met office UM model) Scatter plot, 18 Mar – 28 Apr ~40 days: n=213 daytime only Short-wave down Bias (nwp-obs): 10 Wm-2 Std : 117 Wm-2 7-day plot. ACCESS-G 1-24hr forecast & SOFS
ACCESS Model Evaluation - Heat Loss Sensible Heat Flux (+ve up) Latent Heat Flux (+ve up) 7-day plot. ACCESS-G 1-24hr forecast & SOFS Net Heat Flux (+ve down) Initial conclusion … nwp cooling ocean
SOFS-NCEP Comparison Josey – Preliminary analysis of SOFS data supplied by Eric Schulz and use for evaluation of NCEP. SOFS data employed covers the period Mar 17 - June 5, 2010… Shortwave Longwave SensibleLatent June 10 March 1 SOFS – Heat Flux Components, Hourly Values
Probing the Air-Sea Interaction Regime • Frequency Distribution of Relative Humidity. • Not fixed at 80% ( assumption made to determine near surface air temperature in some satellite flux datasets). 80 50 20 60 100 Relative Humidity (%) Latent Heat Flux (W m-2) • Joint variation of turbulent heat flux terms. • Test of different flux datasets. -250 -250 50 Sensible Heat Flux (W m-2)
NCEP Comparison Data • Daily mean heat flux values obtained from NCEP/NCAR reanalysis grid cell co-located with mooring. Shortwave Longwave SensibleLatent Heat Flux (W m-2) • SOFS hourly data averaged up to form daily means, some missing data due to telemetry problems. • Days with missing data excluded from subsequent analysis. Jan 1 June 10 Year Day (2010)
SOFS-NCEP Daily Mean Comparison • Time series of daily mean net heat flux from NCEP and SOFS. • Surprisingly good agreement between NCEP and SOFS turbulent heat loss terms. • Due to SOFS meteorological data being assimilated within the reanalysis? • No…Schulz has confirmed data held back. • Poorer agreement for longwave. • Vital to ensure flux buoy data held back from NWP centres …JAMSTEC buoy. NCEP SOFS March 17 June 10
SOFS-NCEP Daily Mean Comparison Difference (NCEP-SOFS) of daily mean terms…
Seasonal Variation in NCEP Quality? • Good NCEP-SOFS agreement to date may reflect more ship obs in March-May? • May also reflect closeness of SOFS buoy to land. Poorer quality NCEP fields expected at JAMSTEC site? Jan Latent 2000-2004 Jul Latent 2000-2004 x ★
Further Surface Flux Deployments • Japanese Mooring: • JAMSTEC: Currently planned for (60 S, 140 E), just north of ice edge - some concerns over impacts of icing on sensors. • How does flux regime compare with conditions at SOFS site? Would a site further north be preferable? x ★ 5 oN of proposed JAMSTEC site (55 oS, 140 oE) • Seasonal cycle at 3 sites according to NCEP… • Net heat flux regime similar at proposed JAMSTEC and SOFS. • Different regime probed if more northern site (55 S, 140 E) adopted instead. JAMSTEC (60 oS, 140 oE) SOFS (46.75 oS, 142 oE)
Annual Mean Conditions at Each Site • Mean fluxes at each site… Heat Flux (W m-2) • 55 oS site provides as interesting a contrast with SOFS as the proposed 60 oS site. Possibly more interesting as supposed to be a site of significant net heat gain according to NCEP…
Assessing the potential of the Atmospheric Infrared Sounder (AIRS) surface temperature and specific humidity in turbulent heat flux estimates in the Southern Ocean Shenfu Dong CIMAS/University of Miami - NOAA/AOML Sarah T. Gille, Janet Sprintall SIO/University of California, San Diego Eric J. Fetzer Jet Propulsion Laboratory, Pasadena, California March 18, 2010
Data and Method Satellite Measurements: surface air temperature (TA), sea surface temperature (TO), and specific humidity (qa) from the Aqua Atmospheric Infrared Sounder (AIRS). AIRS version 5 level 3 data are used. AIRS L3 products are derived from L2 (swath) data that has been binned and averaged onto a 11 grid. Shipboard Measurements: near surface temperature, humidity, and wind data from the R/V Laurence M. Gould (LMG), the principal supply ship of the U.S. Antarctic Program for Palmer Station. A total of 88 ship crossings from September 2002 to June 2007.
Temperature and Specific Humidity Distribution sea surface temperature (TO) surface air temperature (TA) specific humidity (qa) • AIRS TA and TO: • Consistently colder than the corresponding shipboard measurements • Better represent the observed meridional variability
Use of Argo to Evaluate Flux Datasets • Sallée et al. (2010) use Argo floats to identify SAM signal in mixed layer depth (MLD). • Mean MLD field shows zonal asymmetry, could potentially be used to evaluate different flux datasets. Winter (August) mean MLD (m) NCEP August Surface Density Flux (Red - surface buoyancy loss, kg m-2 s-1)
Summary • What do we know? • Balance between large ocean heat gain (shortwave) and wind-driven heat loss (latent) components. • Major seasonal cycle. • What don’t we know? • - Sign of annual mean heat exchange over much of the region. • - Key air temp and humidity fields. Particularly in Pacific sector. • - Very little about freshwater budget, with consequent errors for the buoyancy exchange • Potential for improvements… • - SOFS and Japanese surface flux buoy evaluations of reanalyses