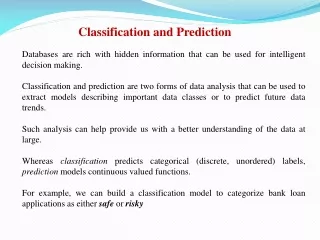
Classification and Prediction
330 likes | 494 Vues
Classification and Prediction. by Yen-Hsien Lee Department of Information Management College of Management National Sun Yat-Sen University March 4, 2003. Outline. Introduction to Classification Decision Tree – ID3 Neural Network – Backpropagation Bayesian Network. Classification.

Classification and Prediction
E N D
Presentation Transcript
Classification and Prediction by Yen-Hsien Lee Department of Information Management College of Management National Sun Yat-Sen University March 4, 2003
Outline • Introduction to Classification • Decision Tree – ID3 • Neural Network – Backpropagation • Bayesian Network
Classification • Purpose: Classification is the process that establishes classes with attributes from a set of instances in a database. The class of an object must be one from a finite set of possible, pre-determined class values, while attributes of the object are descriptions of the object potentially affecting its class. • Techniques: ID3 and its descendants, backpropagation neural network, Bayesian Network, CN2, AQ family, etc.
ID3 Approach • ID3 uses an iterative method to build up decision trees, preferring simple trees over complex ones, on the theory that simple trees are more accurate classifiers of future inputs. • ID3 accomplishes the development of a minimal tree by using an information theoretic approach. By determining the amount of information that can be gained by testing each possible attribute and selecting the one containing the largest amount of information, the decision tree can be optimized.
Outlook Windy Sunny Rain True False Overcast Windy Humidity Humidity N P True False High Normal High Normal Windy P N Outlook P P Sunny True False Rain Overcast N P N P null Example: Complex Decision Tree Temperature Cool Mild Hot Outlook Sunny Rain Overcast Windy P P True False N P
Humidity Windy High Normal True False N P N P Example: Simple Decision Tree Outlook Sunny Rain Overcast P
Entropy Function • Entropy of a set C of objects (examples): Set C (total objects = n = n1+n2+n3+n4) E(C) = - (n1/n)*log2(n1/n) - (n2/n)*log2(n2/n) - (n3/n)*log2(n3/n) - (n4/n)*log2(n4/n) Class 2 (n2) Class 1 (n1) Class 3 (n3) Class 4 (n4)
Entropy Function (Cont’d) • Entropy of a partial tree of C if a particular attribute is chosen for partitioning C:
Class 2 (m2) Class 2 (p2) Class 1 (m1) Class 3 (m3) Class 1 (p1) Class 3 (p3) Class 4 (m4) Class 4 (p4) Entropy Function (Cont’d) Set C (total objects = n = n1+n2+n3+n4) E(C) = - (n1/n)*log2(n1/n) - (n2/n)*log2(n2/n) - (n3/n)*log2(n3/n) - (n4/n)*log2(n4/n) Class 2 (n2) Class 1 (n1) Class 3 (n3) Class 4 (n4) Set C is partitioned into subsets C1, C2, ... by attribute Ai Subset C1 (m = m1+m2+m3+m4) Subset C2 (p = p1+p2+p3+p4) . . . E(Ai) = (m/n)*E(C1) + (p/n)*E(C2) + . . . E(C1) = - (m1/m)*log2(m1/m) - (m2/m)*log2(m2/m) - (m3/m)*log2(m3/m) - (m4/m)*log2(m4/m) E(C2) = - (p1/p)*log2(p1/p) - (p2/p)*log2(p2/p) - (p3/p)*log2(p3/p) - (p4/p)*log2(p4/p)
Class 2 (m2) Class 2 (p2) Class 1 (m1) Class 3 (m3) Class 1 (p1) Class 3 (p3) Class 4 (m4) Class 4 (p4) Information GainDue to Attribute Partition Set C (total objects = n = n1+n2+n3+n4) Class 2 (n2) Entropy of Set C = E(C) Class 1 (n1) Class 3 (n3) Class 4 (n4) Set C is partitioned into subsets C1, C2, ... by attribute Ai Subset C1 (m = m1+m2+m3+m4) Subset C2 (p = p1+p2+p3+p4) Entropy of the partial tree of C (based on attribute Ai) = E(Ai) . . . Thus, the information gain due to the partition by the attribute Ai is Gi = E(C) - E(Ai)
ID3 Algorithm • Start from the root node and assign the root node as the current node C. • If all objects in the current node C belong to the same class, then stop (the termination condition for the current node C) else go to step 3. • Calculate the entropy E(C) for the node C. • Calculate the entropy E(Ai) of the partial tree partitioned by an attribute Ai which has not been used as classifying attributes of the node C. • Compute the information gain Gi for the partial tree (i.e., Gi =E(C) - E(Ai)).
ID3 Algorithm (Cont’d) • Repeat step 4 and 5 for each attribute which has not been used as classifying attributes of the node C. • Select the attribute with the maximum information gain (max Gi) as the classifying attribute for the node C. • Create child nodes C1, C2, ..., and Cn (assume the selected attribute has n values) for the node C; and assign objects in the node C to appropriate child nodes according to the values of the classifying attribute. • Mark the selected attribute as a classifying attribute of each node Ci. For each node C1, assign it as the current node and go to step 2.
Example (See Slide 5) • Current node C = root node of the tree. • Entropy of the node C = E(C) = -(9/14)log2(9/14) - (5/14)log2(5/14) = 0.940 Class P: Objects 3, 4, 5, 7, 9, 10, 11, 12, 13 Class N: Objects 1, 2, 6, 8, 14
Example (Cont’d) • Entropy of the partial tree based on the Outlook attribute: E(Outlook=Sunny) = -(3/5)log2(3/5) - (2/5)log2(2/5) = 0.971 E(Outlook=Overcast) = -(0/4)log2(0/4) - (4/4)log2(4/4) = 0 E(Outlook=Rain) = -(2/5)log2(2/5) - (3/5)log2(3/5) = 0.971 E(Outlook) = (5/14)*E(Outlook=Sunny) + (4/14)*E(Outlook=Overcast) + (5/14)*E(Outlook=Rain) = 0.694
Example (Cont’d) • Information gain due to the partition by the Outlook attribute: G(Outlook) = E(C) - E(Outlook) = 0.246 • Similarly, the information gains due to the partition by the Temperature, Humidity and Windy attributes, respectively, are: G(Temperature) = 0.029 G(Humidity) = 0.151 G(Windy) = 0.048 • Thus, the Outlook attribute is selected as the classifying attribute for the current node C since its information gain is the largest among all of the attributes.
Example (Cont’d) • The resulted partial decision tree is: • The analysis continues for the node C1 and C2 until all of the leaf nodes are associated with objects of the same class. Outlook Sunny Rain Overcast Objects: 1, 2, 8, 9, 11 Objects: 4, 5, 6, 10, 14 P Objects: 3, 7, 12, 13
Humidity Windy High Normal True False Objects: 3, 7, 12, 13 N P N P Objects: 6, 14 Objects: 4, 5, 10 Objects: 1, 2, 8 Objects: 9, 11 Example (Cont’d) Outlook • The resulted final decision tree is: Sunny Overcast Rain P
Issues of Decision Tree • How to deal with continuous attribute. • Pruning tree to make it not case-sensitive. • A better metric than information gains to evaluate tree expansion. Information gains would prefer to attribute with more attribute-value.
Characteristics of Neural Network (“Connectionist”) Architecture • Neural network consists of many simple interconnected processing elements. • The processing elements are often grouped together into linear arrays called “layers”. • A neural network always has an input layer and an output layer and may have or may not have “hidden” layers. • Each processing elements has a number of input xi, which carry various wji. The processing element sums the weighted inputs wjixi and computes a single output signal yj that is a function f of that weighted sum.
Characteristics of Neural Network (“Connectionist”) Architecture (Cont’d) • The function f, called the transfer function, is fixed for the life of the processing element. A typical transfer function is the sigmod function. • The function f is the object of a design decision and cannot dynamically be changed. On the other hand, the weights wji are variables and can dynamically be adjusted to produce a given output. This dynamic modification of weights is what allows a neural network to memorize information, to adapt, and to learn.
Neural Network Processing Element x1 wj1 wj2 x2 f yj . . . wj1 xi
Architecture of Three-Layer Neural Network . . . Output Layer . . . Hidden Layer . . . Input Layer
Backpropagation Network • A fully connected, layered, feedforward and train backward neural network. • Each unit (processing element) in one layer is connected in the forward direction to every unit in the next layer. • A backpropagation network typically starts out with a random set of weights. • The network adjusts its weights each time it sees an input-output pair. Each pair requires two stages: a forward pass and backward pass. • The forward pass involves presenting a sample input to the network and letting activations flow until they reach the output layer.
Backpropagation Network (Cont’d) • During the backward pass, the network’s actual output (from the forward pass) is compared with the target output and error estimates are computed for the output units. The weights connected to the output units can be adjusted in order to reduce those errors. • We can then use the error estimates of the output units to derive error estimates for the units in the hidden layers. Finally, errors are propagated back to the connections stemming from the input units.
Issues of Backpropagation Network • How to present data. • How to decide number of layers. • Learning strategy.
Bayesian Classification • Bayesian classification is based on Bayes theorem. • Bayesian classifier predict class membership probabilities, such as the probability that a given sample belongs to a particular class. • Naïve Bayesian classifiers assume that the effect of an attribute value on a given class is independent of the values of the other attributes. • Bayesian belief networks are graphical models, which unlike naïve Bayesian classifiers, allow the representation of dependencies among subsets of attributes.
Bayes Theorem • Let H be hypothesis, and X be a data sample • P(H|X) is posterior probability of H given X. • P(X|H) is posterior probability of X given H. • P(H) is prior probability of H. • P(X), P(H), and P(X|H) may be estimated from the given data.
Naïve Bayesian Classification • Assume there being a n attributes, unknown class, data sample X = (x1, x2,…, xn). The process to predict the class (C1, C2, …, Cm) X belongs to in Naïve Bayesian Classifier is as follows: 1. Compute the posterior probability, conditioned on X, for each class. 2. Assign X to the class that has the highest posterior probability, i.e. P(Ci|X) > P(Cj|X) for 1 j m, j i
Naïve Bayesian Classification (Cont’d) • Due to , and P(X) is constant for all classes, only P(X|Ci)P(Ci) need be maximized. • Besides, the naïve Bayesian Classifier assume that there are no dependence relationships among the attributes. Thus,
Example • To classify data sample X = (Outlook = Sunny, Temperature = Hot, Humidity = Normal, Windy = False), we need to maximize P(X|Ci)P(Ci). • Compute P(Ci) P(Class = P) = 9/14 = 0.643 P(Class = N) = 5/14 = 0.357 • Compute P(Xk|Ci) P(Outlook = Sunny | Class = P) = 2/9 = 0.222 P(Outlook = Sunny | Class = N) = 3/5 = 0.600 P(Temperature = Hot | Class = P) = 2/9 = 0.222 P(Temperature = Hot | Class = N) = 2/5 = 0.400 P(Humidity = Normal | Class = P) = 6/9 = 0.667 P(Humidity = Normal | Class = N) = 1/5 = 0.200 P(Windy = False | Class = P) = 6/9 = 0.667 P(Windy = False | Class = N) = 2/5 = 0.400
Example (Cont’d) • Compute P(X|Ci) P(X | Class = P) = 0.222 x 0.222 x 0.667 x 0.667 = 0.022 P(X | Class = N) = 0.600 x 0.400 x 0.200 x 0.400 = 0.019 • Compute P(X|Ci)P(Ci) P(X | Class = P)P(Class = P) = 0.022 x 0.643 = 0.014 P(X | Class = N)P(Class = N) = 0.019 x 0.357 = 0.007 • Conclude: X belongs to Class P