Download

1 / 11
110 likes | 235 Vues
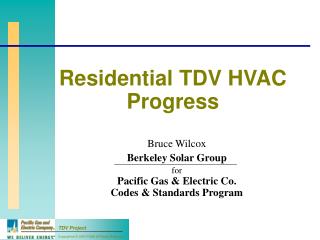
This document provides a comprehensive overview of the long-run marginal costs of electricity supply, calculated for eight cities across diverse climate zones in the U.S. The analysis supports air conditioner appliance standards and utilizes TMY3 weather data, acknowledging various climatic and market factors. The methodology aligns with the California Title 24 TDV values revised in 2005, ensuring transparency and non-proprietary data availability. For further details, including documentation and spreadsheets, visit www.ethree.com/National_Time-Dependent_Values.html or contact Snuller Price at Energy and Environmental Economics, Inc.

E N D
Draft National TDV Values 1/22/09 Contact Information Snuller Price, Partner Energy and Environmental Economics, Inc. 101 Montgomery Street, Suite 1600 San Francisco, CA 94104 snuller@ethree.com (415)391-5100
TDV Value Overview • Estimates of long-run marginal cost of electricity supply • Computed for 8 cities across US climate zones for use in air conditioner appliance standards • Cities selected based on range of climates and air conditioner market size • Correlated to TMY3 weather data, and an assumed weekday / weekend and holiday day-order of 1991 • Methodology similar to California Title 24 TDV values introduced in 2005 Title 24 Update • Only publicly available data was used • Non-proprietary spreadsheet formulation and documentation available on the web • www.ethree.com/National_Time-Dependent_Values.html
Chicago, IL Fresno, CA New York, NY St. Louis, MO Washington DC Phoenix, AZ Atlanta, GA Houston, TX Climate Zones and Cities
Comparison of Actual and Predicted System Loads - Washington DC
Comparison of Actual and Predicted Energy Prices – Washington DC Note that that the capacity value of the TDVs are not shown in the chart above, and therefore do not capture the extreme peaks.
More Information • Documentation, spreadsheets, and more information available at www.ethree.com/National_Time-Dependent_Values.html • Contact Information Snuller Price, Partner Energy and Environmental Economics, Inc. 101 Montgomery St., Suite 1600 San Francisco, CA 94104 snuller@ethree.com (415)391-5100