Download
1 / 14
140 likes | 256 Vues
This study investigates the presence of horizontal gene transfer (HGT) in prokaryotes through the analysis of CRISPR sequences and associated Cas genes. While eukaryotes feature a significant amount of repetitive DNA, prokaryotes like E. coli exhibit a higher protein-coding capacity with minimal repetitive content. By comparing Cas genes across 115 species, we reveal correlations between gene functions and evolutionary pathways. The findings highlight the importance of CRISPR systems in understanding gene transfer mechanisms, contributing to the broader field of microbial genetics and evolution.

E N D
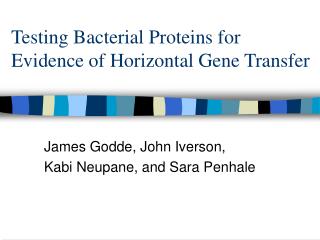
Testing Bacterial Proteins for Evidence of Horizontal Gene Transfer James Godde, John Iverson, Kabi Neupane, and Sara Penhale
Repetitive DNA • Found in abundance in Eukaryotes Only 1% of the human genome encodes protein, while more than half of the genome consists of repetitive DNA. • Relatively rare in Prokaryotes Nearly 89% of the E. coli genome encodes protein, while less than 1% consists of repetitive DNA
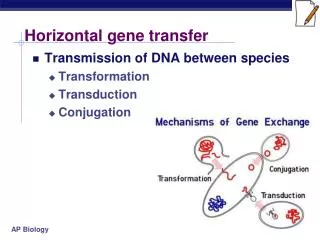
CRISPRs • What is a CRISPR? • Clustered Regularly Interspersed Short Palindromic Repeats • Class of repeats found exclusively in prokaryotes • How widespread are they? Frequency of Occurrence Unknown • What is their function? Function Unknown • How did they get there in the first place? Mode of Transmission Unknown
What are Cas genes? • In addition to the CRISPR sequences themselves, there are a number of genes usually found in close association with the regions of repetitive DNA • These genes were termed Cas (CRISPR associated) genes • There are 4 Cas genes which have been characterized to date. The function of each gene can be guessed at due to similarities they share with known genes: • Cas 1 is homologous to a DNA repair gene • Cas 2 is homologous to a transposase • Cas 3 is homologous to a helicase • Cas 4 is homologous to RecB exonuclease
Finding Cas genes • Cas genes were found by using NCBI BLAST to search for homologs to previously characterized Cas genes (Jansen et al., 2002), as well as to any newly characterized ones • In addition to homology with other genes, Cas genes had to be located near CRISPR sequences themselves
Cas 1 Cas 2 Cas 3 Cas 4
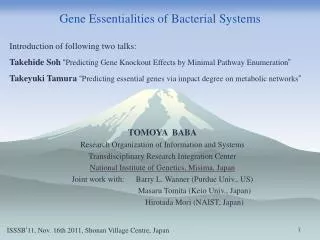
Formation of a total evidence tree • Cas genes have been found in 115 different species of prokaryotes • Analysis was limited to the 58 species for which sequence data were available for all four Cas genes • Protein sequences for all Cas genes were concatenated and aligned using Clustal W • Combined dataset was used to draw a neighbor-joining tree with MacVector
Classical rRNA-based Phylogeny Eukarya Archaea Bacteria Yang et al., 2005
Classical rRNA-based Phylogeny Bacteria Archaea Yang et al., 2005
Method: Neighbor Joining; Best Tree; tie breaking = Random Distance: Absolute (# differences) Gaps distributed proportionally Nostoc pun 462.82 Nanoarchaem 400.18 Pyrococcus hor 1 503.823 Archaeoglobus 2 461.177 Methanobacterium 396.724 Thermotoga 443.276 Rubrobacter 420.201 Clostridium ther 444.953 Desulfobacterium 2 397.047 Thermoanaerobacter 466.496 Fusobacterium 491.409 Moorella 2 397.048 Porphyromonas 356.952 Bacteroides Methanosarcina bar 261.984 Methanosarcina acet 364.747 Methanococcus Pyrococcus hor 2 229.253 Pyrococcus fur 525.293 Chloroflexus 590.433 Corynebacterium 549.823 Chlorobium 2 407.176 Desulfovibrio desul 461.936 Rhodospillium 1 230.257 Salmonella typhi CT18 240.755 Salmonella typhimurium 233.245 E. coli K12 367.033 E. coli 0157 364.967 Geobacter sulf 344.971 Photobacterium (mega) 350.083 Sulfolobus tok 410.917 Sulfolobus sol 361.245 Archaeoglobus 1 511.755 Methanosarcina maz 310.026 Leptospira (lai) 443.945 Streptococcus pyo 1 Streptococcus aga 2603 384.555 Streptococcus aga NEM316 324.992 Streptococcus pyo 2 276.008 Streptococcus mut 356.965 Moorella 1 340.257 Geobacter meta 327.743 Methylococcus 410.048 Magnetococcus 300.729 Chlorobium 1 329.271 Desulfovibrio vul (mega) 370.48 Shewanella (Sargasso Sea) 328.255 Rhodospillium 2 243.306 Xanthomonas 215.778 Chromobacterium 228.222 Azotobacter 410.47 Bacillus halo 395.173 414.53 Desulfobacterium 1 431.986 Pyrobaculum aero 531.322 Thermus HB8 (mega) 492.327 Synechocystis (mega) Nostoc 7120 200.0 Archaea
Method: Neighbor Joining; Best Tree; tie breaking = Random Distance: Absolute (# differences) Gaps distributed proportionally Nostoc pun 462.82 Nanoarchaem 400.18 Pyrococcus hor 1 503.823 Archaeoglobus 2 461.177 Methanobacterium 396.724 Thermotoga 443.276 Rubrobacter 420.201 Clostridium ther 444.953 Desulfobacterium 2 397.047 Thermoanaerobacter 466.496 Fusobacterium 491.409 Moorella 2 397.048 Porphyromonas 356.952 Bacteroides Methanosarcina bar 261.984 Methanosarcina acet 364.747 Methanococcus Pyrococcus hor 2 229.253 Pyrococcus fur 525.293 Chloroflexus 590.433 Corynebacterium 549.823 Chlorobium 2 407.176 Desulfovibrio desul 461.936 Rhodospillium 1 230.257 Salmonella typhi CT18 240.755 Salmonella typhimurium 233.245 E. coli K12 367.033 E. coli 0157 364.967 Geobacter sulf 344.971 Photobacterium (mega) 350.083 Sulfolobus tok 410.917 Sulfolobus sol 361.245 Archaeoglobus 1 511.755 Methanosarcina maz 310.026 Leptospira (lai) 443.945 Streptococcus pyo 1 Streptococcus aga 2603 384.555 Streptococcus aga NEM316 324.992 Streptococcus pyo 2 276.008 Streptococcus mut 356.965 Moorella 1 340.257 Geobacter meta 327.743 Methylococcus 410.048 Magnetococcus 300.729 Chlorobium 1 329.271 Desulfovibrio vul (mega) 370.48 Shewanella (Sargasso Sea) 328.255 Rhodospillium 2 243.306 Xanthomonas 215.778 Chromobacterium 228.222 Azotobacter 410.47 Bacillus halo 395.173 414.53 Desulfobacterium 1 431.986 Pyrobaculum aero 531.322 Thermus HB8 (mega) 492.327 Synechocystis (mega) Nostoc 7120 200.0 Proteobacteria
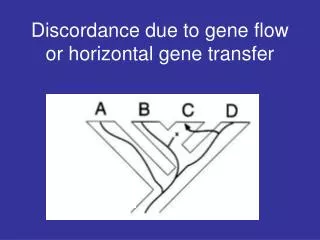
Conclusions • The total evidence tree is a good representation of the individual Cas gene trees, and can be used to draw the same conclusions • The trees support the hypothesis that Cas genes have been passed via horizontal gene transfer • More work is required to eliminate the alternate hypothesis that the trees reflect convergent evolution in response to similar environments
References • Yang, S. Doolittle, R. F., and Bourne, P. E. 2005. Phylogeny determined by protein domain content. PNAS 102:373-378. • Jansen, R., van Embden, J. D., Gaastra, W., and Schouls, L. M. 2002. Identification of genes that are associated with DNA repeats in prokaryotes. Mol. Microbiol. 43:1565-1575.