Residual Term
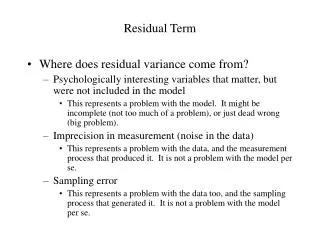
Residual Term. Where does residual variance come from? Psychologically interesting variables that matter, but were not included in the model This represents a problem with the model. It might be incomplete (not too much of a problem), or just dead wrong (big problem).

Residual Term
E N D
Presentation Transcript
Residual Term • Where does residual variance come from? • Psychologically interesting variables that matter, but were not included in the model • This represents a problem with the model. It might be incomplete (not too much of a problem), or just dead wrong (big problem). • Imprecision in measurement (noise in the data) • This represents a problem with the data, and the measurement process that produced it. It is not a problem with the model per se. • Sampling error • This represents a problem with the data too, and the sampling process that generated it. It is not a problem with the model per se.
Psychologically interesting variables that matter, but are not included in the model • Data x y [1] -2 6 [2] -1 2 [3] 0 2 [4] 1 6 [5] 2 14 real model: Y = 2 + 2X + 2X2 Model studied: y-hat = a + bX, where a = 6, b = 2 R2 .42 58% of the variance is residual variance
Psychologically interesting variables that matter, but are not included in the model real model: Y = 2 + 2X + 2X2 R2 ~ 1 0% of the variance is residual variance Previously, the imperfection in the model’s ability to explain the data was a result of having omitted a critical term in the model. We had a decent model, but it was wrong.
Imprecision in measurement (noise in the data) • A measured score can be broken down into three components: • X = T + E + S • X = observed score or measurement • T = “True” score • E = random error component • S = systematic error component (we’ll ignore this component in this class; I discuss it in Psych 242) • X = T + E • measurement example
Random measurement error • Theoretically, random error assumes the shape of a normal distribution, centered at zero. As a consequence, the errors tend to be just as likely to result in scores that are higher than the true scores as scores that are lower than the true scores.
Example X = T + E Obs. 1 10 10 0 Obs. 2 9 10 -1 Obs. 3 10 10 0 Obs. 4 11 10 +1 Obs. 5 8 10 -2 Obs. 6 10 10 0 Obs. 7 12 10 +2 Average 10 10 0 Note: The average of the seven X’s is equal to T
Reliability • Reliability: the extent to which measurements are free of random errors • Random error: nonsystematic mistakes in measurement • misreading a questionnaire item • observer looks away when coding behavior • nonsystematic misinterpretations of a behavior
Reliability • What are the implications of random measurement errors for the quality of our measurements?
Reliability • X = T + E • The error becomes a part of what we’re measuring • Once we’ve taken a measurement, we have an equation with two unknowns. We need ways to separate the relative contribution of T and E. 10 = T + E
Reliability: Estimating reliability • Question: How can we estimate the reliability of our measurements? • Answer: Two common ways: (a) test-retest reliability (b) internal consistency reliability
Reliability: Estimating reliability • Test-retest reliability: Reliability assessed by measuring something at least twice at different time points. • The logic is as follows: If the errors of measurement are truly random, then the same errors are unlikely to be made more than once. Thus, to the degree that two measurements of the same thing agree, it is unlikely that those measurements contain random error.
Reliability: Estimating reliability • We can estimate reliability with test-retest methods by considering the assumed causal relationships among variables. • Parallel tests XT=1 XT=2 1.00
Reliability: Estimating reliability • Internal consistency: Reliability assessed by measuring something at least twice within the same broad slice of time. Split-half: based on an arbitrary split (e.g, comparing odd and even, first half and second half) Cronbach’s alpha (): based on the average of all possible split-halves • SPSS example
Less error More error Item A 4 3 Item B 5 5 Item C 6 7 Item D 5 5 4 3 Item E Item F 5 5 Items A, B, & C yield an average score of (3+5+7)/3 = 5. Items A, B, & C yield an average score of (4+5+6)/3 = 5. Items D, E, & F yield an average scores of (5, 3, 5)/3 = 4.3. Items D, E, & F yield an average scores of (5, 4, 5)/3 = 4.6. These two estimates are off by only .4 of a point. These two estimates are off by .7 of a point.
Reliability: Final notes • An important implication: As you increase the number of indicators, the amount of random error in the averaged measurement decreases. • An important assumption: The entity being measured is not changing. • An important note: Common indices of reliability range from 0 to 1; higher numbers indicate better reliability (i.e., less random error).
Reliability: Implications • These demonstrations suggest that one important way to help eliminate the influence of random errors of measurement is to use multiple measurements. • operationally define latent variables via multiple indicators • use more than one observer when quantifying behaviors
Another Example • Here we have the same basic model, but random error has been added to each observation y e (y+e) [1] 6 -1 5 [2] 2 2 4 [3] 2 -2 0 [4] 6 0 6 [5] 14 -1 13
Example • An important note: If the errors are truly random, we’ll get the close-to-correct parameter non-standardized estimates, but the fit of the model to the data will be less than perfect. • Y = 1.8 + 1.8X + 1.9X2 • The R2 is .90. The error reflects errors in measurement, not a fundamental problem with the model itself.
Sampling error • Error that occurs in data due to the errors inherent in sampling from a population • Population: the group of interest (e.g., all students at UIC) • Sample: a subset of the population that is studied (i.e., people in this class) • Symbols for making the distinction: • = mu = population mean; M = sample mean • = sigma = population standard deviation; s = SD = sample SD • 2 population variance; s2 = sample variance • Note: For some reason, the problem of sampling error seems to worry psychologists more than the other two problems that we have discussed.