The Perfect Storm
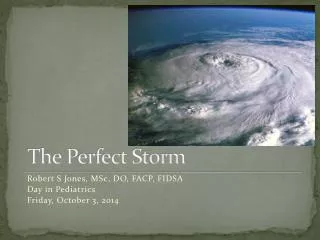
The Perfect Storm. STRIMA 2011. Mark A. Goode, CIC, CPCU Executive Vice President Willis Public Entity Group Mark.Goode@willis.com 704.344.4867 (office) 704.904.1792 (mobile). The Perfect Storm STRIMA 2011. TOPICS Current Market Place Conditions

The Perfect Storm
E N D
Presentation Transcript
The Perfect Storm STRIMA 2011 Mark A. Goode, CIC, CPCU Executive Vice President Willis Public Entity Group Mark.Goode@willis.com 704.344.4867 (office) 704.904.1792 (mobile)
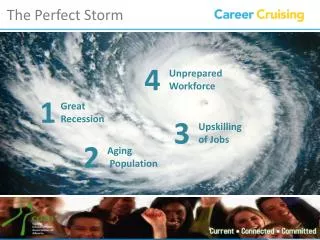
The Perfect StormSTRIMA 2011 • TOPICS • Current Market Place Conditions • Factors Contributing to Market Volatility • Impact of RMS 11 • Impact on the Client
Current Marketplace Conditions • HARD OR SOFT MARKET? • Transition • Stressed • Volatile • “In Flux” • Fragile • Under Pressure • Dysfunctional • Inconsistent • Fluid • Schizophrenic
Large Account Property Rate Change Q2 - 2011 Japanese Earthquake RMS 11.0 debuts 14.46% increase in 60 days Data includes 30 shared and layered accounts bound between April 1st and June 30th 2011
Factors Contributing to Market Volatility • Deteriorating Carrier Financial Results • Black Swan Events • Political Uncertainty • Inflation Fears • Re-Insurance Treaty Premium Increases • Minimal / No Investment Income • RMS 11
2nd Quarter Insured US Catastrophe Losses, 2000-2011 For the 2nd Quarter of 2011, CAT losses in the US have topped $15 billion For the 2nd Quarters of 2000-2010, the average US Insured loss was $4 billion. Data Sourced from Insurance Information Institute, Is the World Becoming Riskier, Dr. Robert Hartwig July 15th, 2011
Industry Combined Ratios, 2000-2010 • The U.S. property/casualty insurance industry’s after tax net income rose $6 billion to $34.7 billion from the previous year. • Increases in net income and overall profitability in 2010 were directly attributable to improvement in investment results. • Lower investment yields less financial leverage mean that combined ratios for insurers must be better (i.e. lower) in order for insurers to achieve ROE on par with past investments. In 2010, Insurers experienced a net growth in written premium for the first time since 2007. • Declines in premiums slowed to .2% down from .6% in 2009 and 3.5% in 2008. Source: ISO 2010 Financial Results
Top 15 Most Costly World Insurance Losses, 1970-2011* 3 of the top 15 most expensive catastrophes in world history have occurred in the past 18 months (Insured Losses, 2010 Dollars, $ Billions) Taken as a single event, the Spring 2011 tornado season would likely become the 9th costliest event in global insurance history *Through June 20, 2011. 2011 disaster figures are estimates; Figures include federally insured flood losses, where applicable. Sources: Swiss Re sigma 1/2011; AIR Worldwide, RMS, Eqecat; Insurance Information Institute. 12/01/09 - 9pm eSlide – P6466 – The Financial Crisis and the Future of the P/C
Worldwide Natural Disasters,1980 – 2011* Number of Events Already 355 events through the first 6 months of 2011 Geophysicalevents(Earthquake, tsunami, volcanic eruption) Meteorologicalevents (Storm) Hydrologicalevents (Flood, mass movement) Climatologicalevents(Extreme temperature, drought, forest fire) *2011 figure is through June 30. Source: MR NatCatSERVICE
Number of Federal Disaster Declarations, 1953-2011* The number of federal disaster declarations is on track to set a new record in 2011, with 48 declarations through July 1. There have been 1,998 federal disaster declarations since 1953. The average number of declarations per year is 34 from 1953-2010, though that few haven’t been recorded since 1995. The Number of Federal Disaster Declarations Is Rising *Through July 1, 2011. Source: Federal Emergency Management Administration: http://www.fema.gov/news/disaster_totals_annual.fema ; Insurance Information Institute.
Major Global Loss Events December 2010: Australia - Flash Flooding January 12th-16th: Brazilian Landslides and Earthquake January 12th: Haitian Earthquake February 2nd: Australia – Cyclone Yasi February 22nd: New Zealand Earthquake March 11th: Japanese Tsunami, Earthquake, Nuclear Disaster April 27th: Tuscaloosa, Alabama Tornado May 22nd: Joplin, Missouri Tornado June 1st: Springfield, Massachusetts Tornado 2011 is already the highest global Loss Year on record $260 billion on worldwide economic losses $55 billion in insured losses Three of the most 15 costly global catastrophes in the world have occurred over the course of the past 18 months Japanese Tsunami: 2nd, $35 billion in losses February New Zealand Earthquake: 9th, $10 billion in losses 2010 Chilean Earthquake: 14th, $8 billion in losses 2011 Black Swan Events Source: Insurance Information Institute: Reinsurance in the Age of Black Swans, Robert P. Hartwig CPCU
Modeling Differences: Regional Variation • Portfolios concentrated across certain geographic areas will be affected by different influencing factors. • The state of Florida is least impacted by the new release of RMS version 11.0 due to a better understanding of wind speed reduction and decreased landfall in the panhandle region. • The State of Texas has the largest increase between versions because of increased inland exposure and poorer construction quality than originally thought.
RMS 9.0 vs RMS 11.0Actual Results (% Change – Same Data Points)
Criteria Necessary for a “Market Turn” Sources: Barclays Capital; Insurance Information Institute. 12/01/09 - 9pm eSlide – P6466 – The Financial Crisis and the Future of the P/C
Stages of the Insurance Cycle Profit • Capital Infusion>>>Increased Capacity • Premium Falls as Capacity is Deployed • Profits Erode into Losses • Severe Underwriting Losses>>>Bottom of Market • Increased Underwriting Standards>>>Rising Premiums>>>Reduced Capacity • “Happy Days are Here Again!” 6 1 2 5 3 4 Loss