Download
1 / 1
10 likes | 118 Vues
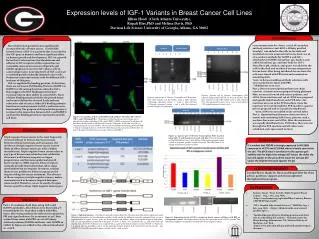
Expression levels of IGF-1 Variants in Breast Cancer Cell Lines Jillian Hood (Clark Atlanta University), Rupali Hire,PhD and Melissa Davis, PhD Davison Life Science University of Georgia, Athens, GA 30602. METHODS Cont’d. ABSTRACT.

E N D
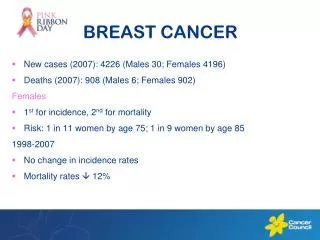
Expression levels of IGF-1 Variants in Breast Cancer Cell Lines Jillian Hood (Clark Atlanta University), Rupali Hire,PhD and Melissa Davis, PhDDavison Life Science University of Georgia, Athens, GA 30602 METHODS Cont’d ABSTRACT room temperature for 1 hour. 100 uL of secondary antibody solution (Anti-hIGF-1 Affinity purified GoatIgG) was added to the cells in the dark and incubated at room temperature for one hour. 100 uL of secondary antibody for IGFBP-6 and IGF-1 (Antibody for IGFBP6: AlexaFluor 350, donkey, anti-rabbit AlexaFluor 350 and Anti-body for IGF-1: AlexaFluor 488, chicken, anti-goat ) was added to the cells in the dark and incubated at room temperature for one hour. After being incubated for one hour the cells were rinsed with PBS twice and mounted on mounting slide. *note: in between adding antibody solutions cells were washed three times with PBS. * All dilutions were 1:100 Part 2: Reverse transcription polymerase chain reaction. A master mix was prepared using platinum blue, necessary forward and reverse primers, and cDNA. Once reactions and 1µl of cDNA were prepared and equally distributed into each PCR tube , the reactions were ran in the PCR machine. Once the reactions were ran through the PCR machine, agarose gel was prepared and we ran gel electrophoresis. *note: cDNA was not added to the control tubes Part 3: Quantitative polymerase chain reaction. A master mix containing SyBr Green, primers 1 and 2, nuclease free water, and cDNA. After the master mix was equally distributed into PCR tubes, they were ran through the PCR machine and all values were calculated and represented in chart. Elevated levels of growth factors significantly increase the risk of breast cancer. Insulin-like Growth Factor 1 (IGF-1) is a protein that is encoded by the IGF1 gene in humans and has a significant effect on human growth and development. IGF-1 is a growth factor that is released into the bloodstream and adheres to IGF receptors within organs that can eventually cause an increase in cell growth and inhibit apoptosis in cancers. IGF-1 plays a role in cancer progression. Lowering levels of IGF-1 can lead to reduced growth of already initiated cancer cells. Numerous transcript variants code for different IGF-1 isoforms of this gene. IGF-1 is regulated by binding proteins. At this time; there are six known IGF Binding Proteins (IGFBP-1 to IGFBP-6) with varying functions related to IGF-1. Data suggests that IGF binding proteins have essential roles in their ability to control IGFs. Some of these binding proteins bind to the growth factor and seem to defuse the elevated levels and may reduce the risk of cancer. Other IGF binding proteins function as carrier proteins for IGF-1 and increase its functionality. The purpose of this particular project is to observe the interaction between IGF-1 and IGFBP-6 and how the binding protein is expressed in specific cell lines. Variant 2 Variant 1 and 3 Variant 1 and 3 Figure4: Agarose gel of Reverse Transcription PCR reaction using primer IGFEXP_CG for each cell line. First lane contains 100 Bp DNA ladder. Lane 4 with cell line HCC 1599 expressed variant 1 and 3 . Lane 6 with cell line CCD 1059sk expressed variant 1 and 3. Figure3: Agarose gel of Reverse Transcription PCR reaction. First well contains 100 Bp ladder. Lane 3 with cell line CCD1059sk expressed variant 2. Lane 6 with cell line CCD1059sk expressed variant 1 and 4 with the expected product length of 233 base pairs. Variant 2 RPL CONCLUSIONS Figure 1: Co-staining of IGF-1 and IGFBP6 with cell lines HCC1806 (ER-), HCC70 (ER+), and CCD1059sk(ER+). The purpose of this fluorescence microscopy was to observe the overlap or binding of IGF-1 and IGFBP6. IGFBP6 is expressed in all three cell lines but is barely visible in cell lines HCC70 and CCD1059sk. In the first row, IGF-1 is expressed in green for each cell line. The second row exhibits the binding protein (IGFBP-6) which is strongly shown in cell line HCC1806 but not seen as much in cell line HCC 70 and CCD1059sk. The third row is a merge of IGF-1 and IGFBP-6. It is evident that IGFBP6 is strongly expressed in HCC1806 compared to HCC70 and CC1059sk where is barely seen inside the cell. The qPCR data in correlation to the agarose gels exhibits that the higher the average dCT values the duller the ban will appear on the gel and the lower the average dCT values the brighter the band appears the gel. INTRODUCTION Triple negative breast cancer is the most frequently detected subtype in African American women. Between African Americans and Caucasians, the incidence of triple negative breast cancer is more likely to affect African Americans with a higher mortality rate.Triple negative breast cancer refers to any type of breast cancer that does not exhibit the three most well-known receptors: estrogen, progesterone, and hormone epidermal growth factor receptor 2 (HER-2) genes. These receptors normally provide instructions that aid in organ development but overexpress in tumors, causing them to over proliferate. These receptors are the targets of drugs for cancer treatment. The absence of these receptors, in triple negative tumors, makes treatments such as hormone targeted therapies unsuccessful. Therefore, we are in search of targets that are specific to these triple negative tumor types. Figure 5: Agarose gel of Reverse Transcription PCR reaction using IGF-1 F and R primers in each cell line. First well contains 100 Bp DNA ladder. Lane 6 with cell line CCD1059sk expressed variant 2 with an expected product length of 232 Bp. The RPL (lanes 9-12) sample was used as a positive control. ACKNOWLEDGEMENTS I would like to thank Dr. Davis and Rupali Hire for their advice, patience, support and encouragement throughout this program. REFERENCES • Komen, Susan. "Facts for Life: Triple Negative Breast Cancer." . N.p., 1 Oct. 2013. Web. . <http://ww5.komen.org/uploadedFiles/Content_Binaries/KOMEED079100.pdf>. • "IGF-1 (Insulin-Like Growth Factor 1)." MESORx. N.p., 1 Jan. 2014. Web. . <https://thinksteroids.com/steroid-profiles/igf-1/>. • "Insulin-like growth factor binding proteins and their role in controlling IGF actions.." National Center for Biotechnology Information. U.S. National Library of Medicine, n.d. Web. . <http://www.ncbi.nlm.nih.gov/pubmed/9174662?report=docsum>. Variant 1 and 2 Variant 1 and 3 Variant 1 and 3 Variant 2 Variant 1 and 2 METHODS Part 1: Co-staining of cell lines using IGF-1 and IGFBP6 antibodies. All cell lines were fixed with 4 % formaldehyde for 1 hour then washed with PBS 3 times. After being washed, the cells were incubated in PBI and signal enhancer for 30 minutes at 37ºC then washed three times with PBS. 100 uL of Primary Antibody solution (IGFBP6 Antibody- Anti-IGFBP6 in rabbit) by Sigma was added to the cells and incubated at…cont’d Figure 2: Splicing Variants. This figure is general concept about the IGF1 gene structure and its expression using alternative promoters and the alternative splicing which results the different transcript isoforms Exons 1-6 are a representation of a gene. Exons 1 and 2 are the promoters and initiate where transcription begins to take place. IGF-1 a-c are represented as isoforms of the gene. For IGF-1-a: Exons 1 or 2 is spliced into 3,4, and 6, but does not express exon 5. For IGF-1-b:Exons 1 or 2 is spliced into 3, 4,and 5, but does not express exon 6. For IGF-1-c: Exons 1 or 2 is spliced into 3,4, partially 5, and 6. In this particular project, primers IGF-1 forward (F) and reverse (R) and IGFEXP_CG1 F and R were used to detect variants 1 and 2, 1 and 4, and 2. Figure 6. Expression levels of IGF-1 variants in breast cancer cell lines with RPL as endogenous control. The higher the bar the less the expression levels of IGF-1 variants. The intensity/ brightness corresponds inversely with the average dCT values.