Download
1 / 10
100 likes | 191 Vues
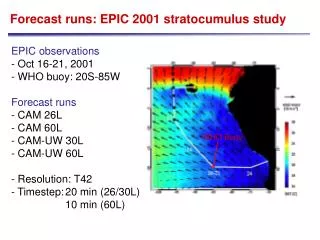
EPIC 2001: 10N, 95W TAO Buoy, Brown, New Horizon. Cruise- avg C-band radar rain rate. 146 km. O(10) differences over 150 km. Study of upper ocean budgets of heat and salt Weakly stratified pycnocline Measurements focused ~20 m and below

E N D
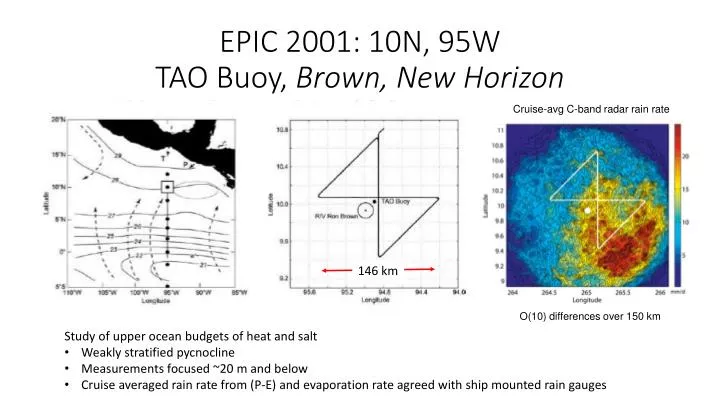
EPIC 2001: 10N, 95WTAO Buoy, Brown, New Horizon Cruise-avg C-band radar rain rate 146 km O(10) differences over 150 km • Study of upper ocean budgets of heat and salt • Weakly stratified pycnocline • Measurements focused ~20 m and below • Cruise averaged rain rate from (P-E) and evaporation rate agreed with ship mounted rain gauges
EPIC Rain Comparisons: Rainfall rate, rr(mm h-1), and cumulative rain, CR (m) Optical Rain Gauge Brown Optical Rain Gauge New Horizon C-Band Radar – 10 km avg Brown • Cumulative rainfall from ship a factor of 2 larger than rain radar averaged over 10 km • Precipitation rates from rain radar average over 100 km radius was 1/3 of ship averages • Rain rate inferred from freshwater budget • Agreed with ship measurements • Differed from rain radar by factor of 2 (10 km avg) or 3 (100 km avg)
Sea Snake, SeaSoar, and MMP(profiler) Time Series • RESIDUAL PATCHES • Frequency of occurrence of large SSS excursions from sea snake much greater than SeaSoar or MMP • TEMPORAL VARIABILITY • Cruise dS/dt from sea snake significantly greater than that from shallowest SeaSoar/MMP measurement Sea Snake Sea Soar MMP
Ship-based Measurement Consideration • Characterize SSS variability: near-surface to 100 m • Surface forcing functions • Characterize spatial and temporal variability • Underway salinity and temperature profiling: 4-6 kts • Skin SST via IR radiometer • Pumped sea snake: 10 cm • Towed SSP (Surface Salinity Profiler) 10 cm to 1 or 2 m • Through hull TSG – Thompson (Brown): 2 m, 3 m, 5 m • Scanfish/towed CTD/MVP: 10-150+ m
Ship-base measurements (continued) • Surface fluxes • Direct covariance • Downwelling/upwelling SW/LW radiation • Precipitation • Spatial scales: Rain radar • Point rain accumulation: disdrometers, capacitance • Surface wave field: Ship-based radar • New Doppler radar being developed at APL-UW • WAMOS • Mapping thermal patches: ship & balloon IR cameras
Interagency Interest: ONR • Physical Oceanography – Scott Harper • Near-surface salinity/DYNAMO • Waveglider innovations • Air-sea fluxes • Near-surface T/S profiles • FLIP • Air-Sea Fluxes • Detailed near-surface T/S: 0-10+ m • Dissipation? • Platform for NSF proposals?
FLIP: Floating Instrument Platform • San Diego to 10N 125W: 1440 nmi (10 day transit at 6 knts) • 35 day duration without underway replenishment • Replenish (food and fuel) from research vessel • Tug considerations
SPURS2: Autonomous Platform Considerations • Persistence and collectively large footprint • Capture seasonality of precipitation cycle • Measure impact of episodic and patchy rain events • Processes controlling evolution of near-surface salinity • Waveglidernear surface measurements • Air-sea fluxes: spatial variability (validate w/ mooring) • Pumped stinger sampling: SSS/SST 0-1m • Passive Acoustics: Rain rate and wind speed • Platforms: Argo, Seaglider, MLF • Central mooring
Autonomous Platforms: Lagrangian Component • Tandem platforms • Wave- or seaglider following Mixed-layer float • Or follow patch of fresh water • EPIC hypothesis: Heavy rain with anticyclonic eddy • Follow eddy/low SSS patch identified by mooring • Seaglider – turbulence • Waveglider – SSS profile and air-sea fluxes EPIC (3-week average) SSH TRMM