Inventory Control Model
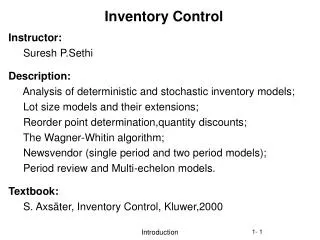
Inventory Control Model. Kusdhianto Setiawan Gadjah Mada University. Planning on what Inventory to stock And how to acquire it. Forecasting Parts/Product Demand. Controlling Inventory Levels. Feedback Measurements To revise plans and forecasts. Inventory Planning & Control.

Inventory Control Model
E N D
Presentation Transcript
Inventory Control Model Kusdhianto Setiawan Gadjah Mada University
Planning on what Inventory to stock And how to acquire it Forecasting Parts/Product Demand Controlling Inventory Levels Feedback Measurements To revise plans and forecasts Inventory Planning & Control
Importance of Inventory Control • The Decoupling Function….. Inventory as a buffer • Storing Resources…. Where JIT is not possible • Irregular Supply and Demand • Quantity Discount • Avoiding stockouts and shortages
Inventory Decision • How much to order • When to order With respect to (constraint) inventory cost: • Cost of the items • Cost of ordering • Cost of carrying/holding • Cost of safey stock • Cost of stockouts
Economic Order Quantity (EOQ) • Objective: Determining how much to order • Assumptions: • Demand is known and constant • Lead time, the time between the placement of the order and the receipt of the order, is known and constant • The receipt of inventory is instantaneous • Quantity discount are not possible • Variable costs: ordering cost and holding/carrying cost • If orders are placed at the right time, stockouts/shortages can be avoided completely
Order Quantity = Q = Maximum inventory level Inventory Level 0 Time Minimum Inventory Level EOQ Continued….
Cost Minimum Total Cost Carrying Cost Curve Optimal Order Quantity Ordering Cost Curve Order Quantity EOQ Continued….
Computing Average Inventory Demand: Constant, 2 units/day Ending Inventory is assumed to be always zero Maximum level = 10 units Total of Daily average = 9 + 7 + 5 + 3 + 1 = 25 Number of days = 5 Average inventory level = 25/5 = 5 …… Q/2
Finding the EOQ • Expression: Q = number of pieces per order Q* = optimal number of pieces per order D = annual demand in units for the inventory items C0 = ordering cost for each order Ch = holding cost per unit per year
Finding the EOQ • Annual Ordering Cost = no. of order placed per year x order cost per order • Annual Holding or Carrying Cost = Average inventory level x carrying cost per unit per year = (Q/2) Ch • Optimal Order Quantity ordering cost = carrying cost (D/Q)Co = (Q/2)Ch 4.
Q* Slope = units/day = d Inventory Level (Units) Time (days) Lead Time = L Finding Reorder Point (ROP) • ROP = (demand/day) x (lead time for a new order in days) • ROP = d x L ROP (units)
EOQ Without The Instantaneous Receipt Assumption Part of inventory cycle during which Production is taking place Inventory Level There is no production During this part of the inventory cycle Maximum Inventory time t Production Run Model
Annual Carrying Cost • New terms: t = length of the production run (days) p = daily production rate • Annual inventory holding/carrying cost = average inventory level x carrying cost/unit/year = average inventory level x Ch • Average inventory level = ½ Maximum inventory level • Maximum inventory level = (total produced during the production run) - (total used during the production run) Q = pt t = Q/p Max Inv. Level = p(Q/p) – d(Q/p) = Q – (d/p)Q = Q(1-d/p) • Annual Inventory carrying cost = ½ (max. inv. Level) x Ch = ½ Q(1-d/p)Ch
Annual Setup/Ordering Cost • Annual setup cost = (no. of setup/year) x (setup cost/setup) = (D/Qp)Cs where: D = annual demand in units Qp = Quantity produced in one batch Cs = setup cost per setup • Annual Ordering Cost = (D/Q)Co
Optimal Order Quantityfor Production Run Model • Ordering Cost = Carrying Cost • (D/Q)Co = ½ ChQ(1-d/p) • Optimal Order Quantity Optimal Production Quantity, Q*p
Quantity Discount Model Quantity Discount Schedule Total Cost = material cost + ordering cost + carrying cost = DC + (D/Q)Co + ½ QCh
Total Cost Curve Total Cost TC for Disc. 1 TC for Disc. 3 TC for Disc. 2 Q* for Disc. 2 Order Quantity 0 1,000 2,000
Use of Safety Stock • Safety stock: additional stock that is kept on hand • It is used only when demand is uncertain • Main purpose: to avoid stockouts when the demand is higher than expected • ROP = d x L (normal condition) • ROP = d x L + SS (demand is uncertain) • Because it is dealing with decision under risk, knowing the probability of demand is necessary.
Safety Stock with Known Stockout Costs Case of ABCO • ROP = 50 units (= d x L) • Ch = $5 (per unit per year) • Cso = $40/unit (stockout cost) • Optimal number of orders per year is 6 • Objective: to find the reorder point, including safety stock, that will minimize total expected cost • Total expected cost is the sum of expected stockout cost plus expected additional carrying cost
Annual Expected Stockout Cost • When the ROP < demand over lead time Total Cost = Stockout Cost = no. of units short x stockout cost/unit x no. of orders per year • When the ROP > demand over lead time Total Cost = total additional carrying cost = no. of surplus units x carrying cost
Safety Stock with Unknown Stockout Cost • There are many situation when stockout cost are unknown or extremely difficult to determine, i.e: major stockout cost is the loss of goodwill, how to measure it? • Alternative approach: using service level • Service level = 1 – probability of a stockout or • Probability of a stockout = 1 – service level
Hinsdale Company Example • Average demand = 350 units • Standard Deviation = 10 • Hinsdale wants to follow a policy that result in stockout occuring only 5% of the time. • How much safety stock should be maintained?
Safety Stock & Normal Distribution σ=10 X = mean + safety stock SS = safety stock = X – μ Z = (X – μ) / σ = SS/ σ Z value for an area under the normal curve of 0.95 (=1-0.05) is 1,65 (see appendix A) SS = 1.65 (10) = 16.5 units or 17 units SS = Z σ SS μ=350 X=?