Download
1 / 49
620 likes | 1.03k Vues
CHAPTER 5 Financial Impact of Inventory. Note: Ending inventory figures are used for inventory investment. All figures are for 1997. Selected Financial Data for Manufacturers, Wholesalers, and Retailers for 1997 ($Millions). Product. Order processing and information costs. Price.

E N D
CHAPTER 5 Financial Impact of Inventory
Note: Ending inventory figures are used for inventory investment. All figures are for 1997. Selected Financial Data for Manufacturers, Wholesalers, and Retailers for 1997 ($Millions)
Product Order processing and information costs Price MARKETING Place/customer service levels Inventory carrying costs Transportation costs LOGISTICS Lot quantity costs Warehousing costs Order processing and information costs Cost Trade-offs in Marketing and Logistics
Components of Inventory Carrying Costs • Capital • Inventory service • Storage space • Inventory risk
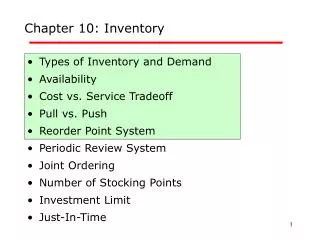
Inventory Management • Inventories are stocks of goods and materials that are maintained to satisfy normal demand patterns • Inventory management • Decisions drive other logistics activities • Different functional areas have different inventory objectives • Inventory costs are important to consider • Inventory turnover
Inventory-Related Costs • Inventory carrying (holding) costs • Obsolescence • Inventory shrinkage • Storage costs • Handling costs • Insurance costs • Taxes • Interest charges • Opportunity cost • Stockouts
Alternative Loss Probability Average Cost 1. Brand-loyal customer $00.00 .10 $00.00 2. Switches and comes back $37.00 .65 $24.05 3. Lost customer $1,200 .25 300.00 Average cost of a stockout 1.00 $324.05 Determination of the Average Cost of a Stockout These are hypothetical figures for illustration.
When to Order • Fixed order quantity system • Fixed order interval system • Reorder point (ROP) ROP = DD x RC under certainty ROP = (DD x RC) + SS under uncertainty Where DD = daily demand RC = length of replenishment cycle SS = safety stock
How Much to Reorder • Economic order quantity (EOQ) in dollars EOQ = √2AB/C Where EOQ = the most economic order size, in dollars A = annual usage, in dollars B = administrative costs per order of placing the order C = carrying costs of the inventory (%)
How Much to Reorder • Economic order quantity (EOQ) in units EOQ = √2AO/IC Where EOQ = the most economic order size, in units A = annual demand, in units O = administrative costs per order of placing the order C = carrying costs of the inventory (%) I = dollar value of the inventory, per unit
Inventory Carrying Number Ordering Total Cost of Orders Cost Order Cost 1/2 Q X C X V (D/Q) PX (D/Q) Quantity 40 120 $ 4,800 $ 500 $ 5,300 60 80 3,200 750 3,950 80 60 2,400 1,000 3,400 100 48 1,920 1,250 3,170 120 40 1,600 1,500 3,100 140 35 1,400 1,750 3,150 160 30 1,200 2,000 3,200 200 24 960 2,500 4,460 300 18 720 3,750 4,470 400 12 480 5,000 5,480 6-7 Cost Trade-offs Required to Determine the Most Economic Order Quantity
Inventory Flows • Safety stock can prevent against two problem areas • Increased rate of demand • Longer-than-normal replenishment • When fixed order quantity system like EOQ is used, time between orders may vary • When reorder point is reached, fixed order quantity is ordered
Contemporary Approaches to Managing Inventory • ABC Analysis • Just-in Time (JIT) Approach • Vendor-Managed Inventory (VMI) • Inventory Tracking • Min-Max
Inventory Management: Special Concerns • Defining stock-keeping units (SKUs) • Dead inventory • Deals • Substitute items • Complementary items • Informal arrangements outside the distribution channel • Repair/replacement parts • Reverse logistics
Inventory Positions in the Manufacturer’s Logistics System Rawmaterialsinventory Finished goodsinventoryat plant Finished goodsinventoryin field In-processinventory Assumptions: A one-time increase (decrease) in finished goods inventory results in a one-time increase (decrease) in raw materials purchased.
Capitalcosts Inventory investment Insurance Inventoryservicecosts Taxes Inventory carrying costs Plant warehouses Public warehouses Storagespace costs Rented warehouses Company-owned warehouses Obsolescence Damage Inventoryrisk costs Pilferage Relocation costs Normative Model of Inventory Carrying Cost Method
Inventory Turns • What is it? • How is it calculated? • Why is it important? • What about inventory days of sales on hand?
Inventory Management • Inventory management • Inventory costs are important to consider • Inventory turnover: cost of goods sold divided by average inventory at cost cost of goods sold = inventory turnover average inventory $200,000 = inventory is sold 4 times per year $ 50,000 • Compare with competitors or benchmarked companies
Inventory Management • Low inventory turnover = high inventory carrying costs, little (or no) stockout costs • High inventory turnover = low inventory carrying costs, high stockout costs • Managing the tradeoff is important to maintain service levels
Inventory Average Carrying Cost Carrying Cost Turns Inventory at 40 Percent Savings 1 $750,000 $300,000 2 375,000 150,000 $150,000 3 250,000 100,000 50,000 4 187,500 75,000 25,000 5 150,000 60,000 15,000 6 125,000 50,000 10,000 7 107,143 42,857 7,143 8 93,750 37,500 5,357 9 83,333 33,333 4,167 10 75,000 30,000 3,333 11 68,182 27,273 2,727 12 62,500 25,000 2,273 13 57,692 23,077 1,923 14 53,571 21,428 1,649 15 50,000 20,000 1,428 The Impact of Inventory Turns on Inventory Carrying Costs
CHAPTER 6 Inventory Management
Inventory Policy Decisions “Every management mistake ends up in inventory.” Michael C. Bergerac Former Chief Executive Revlon, Inc.
What are Inventories? • Finished product held for sale • Goods in warehouses • Work in process • Goods in transit • Staff hired to meet service needs • Any owned or financially controlled raw material, work in process, and/or finished good or service held in anticipation of a sale but not yet sold • An addiction – to cure ills CR (2004) Prentice Hall, Inc.
Finished goods Customers Material Inbound Production Outbound warehousing sources transportation transportation Receiving Production materials Inventories in-process Shipping Finished goods Inventory locations Where are Inventories? 9-4 CR (2004) Prentice Hall, Inc.
Purposes of Inventory • Enables the firm to achieve economies of scale • Balances supply and demand • Enables specialization in manufacturing • Provides protection from uncertainties in demand and order cycle • Acts as a buffer between critical interfaces within the supply chain • Cover up inefficiencies in operations • Smooth variances in customer demand
Reasons for Inventories • Improve customer service • Provides immediacy in product availability • Encourage production, purchase, and transportation economies • Allows for long production runs • Takes advantage of price-quantity discounts • Allows for transport economies from larger shipment sizes • Act as a hedge against price changes • Allows purchasing to take place under most favorable price terms • Protect against uncertainties in demand and lead times • Provides a measure of safety to keep operations running when demand levels and lead times cannot be known for sure • Act as a hedge against contingencies • Buffers against such events as strikes, fires, and disruptions in supply CR (2004) Prentice Hall, Inc.
Reasons Against Inventories • They consume capital resources that might be put to better use elsewhere in the firm • They too often mask quality problems that would more immediately be solved without their presence • They divert management’s attention away from careful planning and control of the supply and distribution channels by promoting an insular attitude about channel management CR (2004) Prentice Hall, Inc.
Types of Inventories • Pipeline • Inventories in transit • Speculative • Goods purchased in anticipation of price increases • Regular/Cyclical/Seasonal • Inventories held to meet normal operating needs • Safety • Extra stocks held in anticipation of demand and lead time uncertainties • Excess inventory • Obsolete/Dead Stock/Dormant • Inventories that are of little or no value due to being out of date, spoiled, damaged, etc.
Nature of Demand • Perpetual demand • Continues well into the foreseeable future • Seasonal demand • Varies with regular peaks and valleys throughout the year • Lumpy demand • Highly variable (3 Mean) • Regular demand • Not highly variable (3 < Mean) • Terminating demand • Demand goes to 0 in foreseeable future • Derived demand • Demand is determined from the demand of another item of which it is a part Accurately forecasting demand is singly the most important factor in good inventory management
Inventory Management Philosophies • Pull • Draws inventory into the stocking location • Each stocking location is considered independent • Maximizes local control of inventories • Push • Allocates production to stocking locations based on overall demand • Encourages economies of scale in production • Just-in-time • Attempts to synchronize stock flows so as to just meet demand as it occurs • Minimizes the need for inventory CR (2004) Prentice Hall, Inc.
Inventory Management Philosophies (Cont’d) • Supply-Driven • Supply quantities and timing are unknown • All supply must be accepted and processed • Inventories are controlled through demand • Aggregate Control • Classification of items: • Groups items according to their sales level based on the 80-20 principle • Allows different control policies for 3 or more broad product groups CR (2004) Prentice Hall, Inc.
Costs Relevant to Inventory Management • Carrying costs • Cost for holding the inventory over time • The primary cost is the cost of money tied up in inventory, but also includes obsolescence, insurance, personal property taxes, and storage costs • Typically, costs range from the cost of short term capital to about 40%/year. The average is about 25%/year of the item value in inventory. CR (2004) Prentice Hall, Inc.
Virtual Inventories • Stockouts are filled from other stocking locations in the distribution network • Customers assigned to a primary stocking location • Backup locations are usually determined by “zoning” rules • Expectation is that lower system-wide inventories can be achieved while maintaining or improving stock availability levels • Total distribution costs should be lower to support the cross filling of customer demand • Warehouse in a warehouse concept CR (2004) Prentice Hall, Inc.
Stock Stock Stock Stock Stock Stock Stock Stock location location location location A A A A location location location location B B B B Primary Primary Primary Primary assignment assignment assignment assignment Primary Primary Primary Primary assignment assignment assignment assignment Secondary Secondary Secondary Secondary assignment assignment assignment assignment Demand 1 Demand 1 Demand 1 Demand 1 Demand 2 Demand 2 Demand 2 Demand 2 Safety Stock in 2 Locations • Meaning of safety stock • Safety stock depends on • Demand dispersion (variance is proportional to (demand) • Fill rate Observation A system of multiple stocking locations will carry its minimumsafety stock when demand is balanced among them 9-89 CR (2004) Prentice Hall, Inc.
Square Root Law of Inventory Consolidation • The amount of inventory (regular stock) at multiple stocking points can be estimated by the square root law when • Inventory control at each point is based on EOQ principles • There is an equal amount on inventory at each point • The square root law is: where IT = amount of inventory at one location Ii = amount of inventory at each of n locations n = number of stocking points 9-97 CR (2004) Prentice Hall, Inc.
Square Root Law (Cont’d) Example Suppose that there is $1,000,000 of inventory at 3 stocking points for a total of $3,000,000. If it were all consolidated into 1 location, we can expect: If we wish to consolidate from 3 to 2 warehouses, the level of inventory in each warehouse would be: For a total system inventory of n x I = 2 x $1,224,745 = $2,449,490. 9-98 CR (2004) Prentice Hall, Inc.
A . O r d e r q u a n t i t y o f 4 0 0 u n i t s I n v e n t o r y O r d e r O r d e r a r r i v a l a r r i v a l 4 0 0 O r d e r O r d e r A v e r a g e p l a c e d p l a c e d c y c l e i n v e n t o r y 2 0 0 0 1 0 2 0 3 0 4 0 5 0 6 0 D a y s a 6-3 a The Effect of Reorder Quantity on Average Inventory Investment with Constant Demand and Lead Time
B . O r d e r q u a n t i t y o f 2 0 0 u n i t s I n v e n t o r y A v e r a g e O r d e r O r d e r c y c l e 2 0 0 a r r i v a l p l a c e d i n v e n t o r y 1 0 0 0 1 0 2 0 3 0 4 0 5 0 6 0 D a y s b 6-3 b The Effect of Reorder Quantity on Average Inventory Investment with Constant Demand and Shortened Lead Time
C . O r d e r q u a n t i t y o f 6 0 0 u n i t s I n v e n t o r y 6 0 0 O r d e r a r r i v a l A v e r a g e O r d e r c y c l e p l a c e d i n v e n t o r y 3 0 0 0 1 0 2 0 3 0 4 0 5 0 6 0 D a y s c 6-3 c The Effect of Reorder Quantity on Average Inventory Investment with Constant Demand and Lenghtened Lead Time
Symptoms of Poor Inventory 6-8 • Increasing numbers of back orders • Increasing dollar investment in inventory with back orders remaining constant. • High customer turnover rate. • Increasing number of orders being canceled. • Periodic lack of sufficient storage space. • Wide variance in inventory turnover among distribution centers and major inventory items.
ABC Analysis • Pareto’s Law – meaningful few and trivial many • 80/20 – based on Pareto’s analysis 80 percent of the wealth was in 20 percent of the people’s hands – in inventory management usually 20 percent of your items account for 80 percent of your inventory dollars
ABC Analysis • Volume • Dollar value • Annual Dollar Value • Customers
Inventory Using ABC • A items inventory monthly • B items quarterly • C items annually or as needed
Summary • EOQ – purpose • Inventory Turns • Types of inventory • Purpose of inventory • Safety stock • Lead times and average inventory
Next Class: • Mid Term Exam • Two weeks - Chapters 7,8