Download
1 / 32
320 likes | 546 Vues
Financial Impact of Drought. March 5, 2008. Updated 3/17/08. Drought Impacts Current Year Budget Future Years’ Budget Rate Adjustments . Budget Review. Consumption. Budget Review. 160. 150. 140. 130. Average. 120. 2008. 110. MGD. 100. 90. 80. July. May. April. June. March.

E N D
Financial Impactof Drought March 5, 2008 Updated 3/17/08
Drought Impacts Current Year Budget Future Years’ Budget Rate Adjustments Budget Review
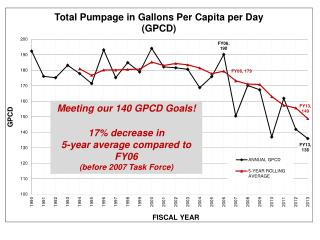
Consumption Budget Review 160 150 140 130 Average 120 2008 110 MGD 100 90 80 July May April June March August January October February November December September
Water Revenues Budget Review Percentage of Total Annual Revenue 14.00% 13.00% 12.00% Average 11.00% 10.00% 2008 9.00% 8.00% 7.00% 6.00% 5.00% July Aug Sept Oct Nov Dec Jan Feb March April May June (In thousands) 2,565 1,753 (158) (3,237) (755) (1,001) (1,101) 285 Expected Loss of $(7,500) 2,850 4,603 4,445 1,208 453 (548) (1,649) Cumulative
Wastewater Revenues Budget Review Percentage of Total Annual Revenue 11.00% 10.50% 10.00% 9.50% Average 9.00% 2008 8.50% 8.00% 7.50% 7.00% 6.50% 6.00% July Aug Sept Oct Nov Dec Jan Feb March April May June 824 797 (2,761) 700 (578) (850) 2,386 640 (In thousands) Expected Loss $(4,300) Cumulative 3,026 3,850 4,647 1,886 2,586 2,008 1,158
Water Rates Budget Review Tiers 2008 > 22 $4.31 12 - 22 $2.18 $1.89 0 - 11 $1.33 * Commercial - $1.73 * Sewer - $3.22
Tap & Capacity Budget Review Budget Actual Shortfall $ 27.4 M $ 20.3 M $ (7.1) M
FY 2008 Projected Budget Review Actual Budget $ 244.8 M $ 226.5 M Revenues Fund Balance 10 M 10 M Total Revenues $ 254.8 M $ 236.5 M Operating 96.2 M 94.5 M Debt Service 129.7 M 129.0 M 28.9 M Pay Go Contribution 28.9 M Total Expenditures $ 252.4 M $ 254.8 M Decrease to Fund Balance $ (15.9) M $ ---
Rate Issues FY 08 Bond Covenants Mandatory Restrictions 1 or 2 watering seasons Long Term Consumption Habits Effect Of Housing Starts Budget Review
Budget Review Bond Covenants Actual Budget 35% Fund Balance 40 .3% 35.4% Test 1 (greater than 1 times debt service, can use fund balance) 1.03 0.94 $(13 M) 1.06 0.97 $(6 M) Test 2 (greater than 1 times debt service)
Projected 09 Water Revenues Budget Review Percentage of Total Annual Revenue 12.00% 11.00% Average 10.00% 2009 9.00% 8.00% 7.00% 6.00% 5.00% July Aug Sept Oct Nov Dec Jan Feb March April May June Full Year Shortfall of $18 Million
Projected 09 Wastewater Revenues Budget Review Percentage of Total Annual Revenue 10.00% 9.50% 9.00% Average 8.50% 2009 8.00% 7.50% 7.00% 6.50% 6.00% July Aug Sept Oct Nov Dec Jan Feb March April May June Full Year Shortfall of $12 Million
Adjustments Revenue Requirement – 23% Delay Capital Operating Savings Reduce Pay Go Budget Review
Rate Increase Model Increase FY2009 - 6.05% Drought Impact – 9.87% Implement May 1, 2008 Budget Review
Why Additional Rates? Fixed vs. Variable Expenses Operations Impacts Rates Driven by Capital Budget Review
Fixed vs. Variable Budget Review Plants $44M Debt Service $159M Overhead $22M Customer Service $6M Lines $24M Water Plants $13M Sewer Plants $31M Dept. Admin $8M City $14M Variable $4.9M Fixed $8.1M 1% Reduction = $49K 1% Reduction in Usage = $1.9M Reduction in Revenue $ 255 Million Total Budget
Field Operations Plants Customer Service Engineering Other Laboratory Budget Review Employees by Division 4% 5% 14% 37% 15% 25%
Employees Per Thousand Accounts Budget Review 2.15 2.08 2.10 2.05 2.02 2.00 1.95 1.91 1.88 1.90 1.83 1.85 1.80 1.77 1.75 1.70 1.65 1.60 2002 2003 2004 2005 2006 2007
Cost of Enforcement to Date Total Cost - $358 k Out of Pocket - $156 k Fines - $237 k Employees Involved - 126 Budget Review
McDowell Creek WWTP Irwin Creek WWTP Sugar Creek WWTP McAlpine Lift Station Budget Review Capital Spending Completed Projects • McDowell Plant Expansion • Southwest Water Main Phase 1 • McAlpine Lift Station Projects Under Way • WW Treatment Plant Expansion • Briar Creek Phase 1 • Southwest Water Main 2 &3 Five Year CIP Projects • Long Creek WWTP • Northeast Water Main • Annexation $ 76 M $ 40 M $ 32 M $ 132 M $ 51 M $ 26 M $ 197 M $ 117 M $ 90 M
Short Term Pain - Long Term Gain Reduced Consumption = Reduced Water Capital Reduction in Size Delay Projects Extends Life of Current Interbasin Transfers Extends Life of Current Federal Energy Regulatory Commission Authorization Budget Review
Work & Asset Management Reduce Capital Repair vs. Replace Life Cycle Cost Risk Assessment Pilot - $9M Reduction Budget Review
Tier Adjustment Budget Review $4.31 +22 +16 $5.16 $2.18 12-22 9-16 $2.61 5-8 $1.59 $1.33 0-11 $1.38 0-4 Current Projected
Impact Budget Review Usage Monthly Increase 4 ccf $2.76 8 ccf $6.36 12 ccf $13.19 * 1 ccf = 748 gallons
Current Usage Usage Projected $40.00 8 ccf 6 ccf $35.46 $49.10 10 ccf 8 ccf $46.36 15 ccf $75.25 12 ccf $72.24 Budget Review Conservation Impact * 1 ccf = 748 gallons
Other Rate Adjustments Budget Review Proposed Existing 24 ccf Sewer Cap 18 ccf * $5.80 per ccf Commercial $4.95 per ccf Begins Tier 3 Irrigation Begins Tier 1 * Water rate - $1.94 per ccf Sewer rate - $3.86 per ccf
Model Budget Review Projected 6.05% 6.74% 6.50% 6.50% 6.50% Rates Recommendation Recommendation 15.92% 9.97% 7.52% 7.56% 6.42% Alternative Alternative 17.84% 7.39% 6.58% 6.62% 6.83% Projected $24 M $21 M $42 M $39 M $60 M Pay Go Recommendation $16 M $17 M $29 M $34 M $57 M Alternative $16 M $17 M $29 M $25 M $48 M Projected 1.22 1.19 1.32 1.27 1.38 Debt Service Recommendation 1.16 1.16 1.26 1.24 1.33 Coverage Alternative 1.18 1.15 1.23 1.20 1.30 Projected 41% 41% 42% 40% 40% Fund Balance 41% 40% 43% 42% 40% 43% 41% 42% 42% 42% 2009 2010 2011 2012 2013
NC & SC Survey Summary of Combined Water and Sanitary Sewer (10 CCF Usage) 2008 Rates Budget Review $59.30 $125.75 $106.84 $140 $91.69 $91.73 $120 $85.45 $83.75 $82.48 $80.93 $81.26 $79.83 $79.94 $78.86 $100 $75.78 $62.37 $80 $58.09 $57.16 $53.45 $49.10 $60 $40 $20 $0 Cary Hickory Monroe Raleigh Durham Concord Rock Hill Asheville Gastonia Charlotte Charleston Chapel Hill Mooresville Kannapolis Greensboro Union County Lincoln County Winston-Salem
Budget Review $59.30 National Survey Summary of Combined Water and Sanitary Sewer (10 CCF Usage) 2008 Rates $160 148.11 $140 128.63 $120 $100 85.66 80.41 75.93 75.68 $80 63.60 60.97 61.21 59.26 56.50 $60 $49.10 48.75 $40 $20 $0 Austin Seattle Atlanta Phoenix Louisville Charlotte Cincinnati Mobile, AL Fort Worth Indianapolis Philadelphia Orlando, FL Richmond, VA
Budget Review $59.30 Survey of Drought Stricken Jurisdictions Summary of Combined Water and Sanitary Sewer (10 CCF Usage) 2008 Rates $160 $148.11 $140 $125.36 $120 $100 $89.32 $85.45 $79.83 $79.94 $75.95 $74.12 $80 $63.55 $59.88 $58.09 $57.16 $60 $49.10 $44.17 $40 $20 $0 Cary Atlanta Raleigh Rock Hill Charlotte Greensboro Marietta, GA Augusta, GA Gwinnett, GA Chapel Hill Columbus, GA Winston Salem Birmingham, AL Cobb County, GA
Budget Review Next Steps • Stakeholder Information - March 6th • Council Agenda - March 24th • Customer Information - April • New Rate - May 1st
Budget Review Conclusion The Value of Water Is Changing • Water is not an unlimited, cheap commodity that can be wasted. • It is rather a valuable, limited resource that sustains life and provides for a growing economy. • The demand for clean drinking water & a clean, sustainable environment goes on – even during a drought.