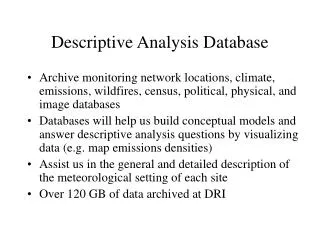
Comprehensive Analysis Database for Meteorological and Environmental Studies
This extensive database archives over 120 GB of crucial data, offering insights into climate, emissions, wildfires, and other environmental factors. It integrates air quality networks, meteorological data from 60 networks, and satellite imagery to visualize trends and assist in descriptive analysis. Users can explore various parameters, including PM10, SO2, and meteorological settings at multiple sites, thereby enhancing understanding of site characteristics and influences. This database is essential for researchers conducting detailed climatic studies and environmental assessments.

Comprehensive Analysis Database for Meteorological and Environmental Studies
E N D
Presentation Transcript
Descriptive Analysis Database • Archive monitoring network locations, climate, emissions, wildfires, census, political, physical, and image databases • Databases will help us build conceptual models and answer descriptive analysis questions by visualizing data (e.g. map emissions densities) • Assist us in the general and detailed description of the meteorological setting of each site • Over 120 GB of data archived at DRI
Sources of Data • Air quality networks (data archived from VIEWS) • IMPROVE and IMPROVE protocol sites • EPA Speciation Trends sites • Other networks (no data archived) • State/local agency SLAMS/NAMS/PAMS sites • PM10, PM2.5, SO2, O3, CO, NOx, met • CASTNet • Special studies (CRPAQS, CCOS, Mohave, Bravo, etc.)
Sources of Data • Existing meteorological data for 60 networks (data not archived) • State/local agency sites • NWS surface and upper air sites • RAWS • NWS Cooperative observers • Department of Defense • Climate data (data archived) • Gridded monthly precipitation for US
Sources of Data • Emissions (data archived) • WRAP 1996 point, mobile, area sources • National Fire data 1970-1999 point locations • USDA fire locations from MODIS satellite 2001-2003 • BLM fire locations for Alaska • Canadian wildfires 1959-1999 • Carnegie Mellon ammonia inventory • 2000 street, airport and railroad centerlines • Sources inferred from landuse/landcover data • Sources inferred from satellite imagery and aerial photos
Emissions surrounding Saguaro Wildfires include those from 1988 to 1999
Sources of Data • Physical and land cover data (data archived) • USGS digital elevation data at 10m, 30m, 90m and 1 km resolutions • USGS STATSGO soils • Limited SSURGO soil data • Census Bureau water bodies, rivers, streams • Vegetation from various agencies • Satellite imagery (Landsat 5 imagery circa 1990 for all of US and recent MODIS for some areas)
Visualizing the Tucson urban area Saguaro East Tucson N Saguaro West Landsat 5 image circa 1990 draped over 30 meter DEM
Sources of Data • Political data • Census Bureau 2000 state, county, urban area, and zip codes boundaries • Census Bureau 2000 census blocks and tract boundaries and demographic data • Land ownership from various state agencies • State, federal and tribal land boundaries from various agencies
Site Questionnaire Site location and history (most of this is available via IMPROVE metadata) • UTM or lat/long coordinate; accuracy of coordinate; how coordinate was collected • Elevation of site • When did the site start or stop? • Changes in monitor/filter technique • Is it collocated with a scene camera? • Site photos • Site operator(s) • Distance to other class I areas • Did the site move over the years?
Site Questionnaire Physical setting: terrain, land use and land cover • Approximate slope surrounding site (percent) • Aspect surrounding site (0-360 degrees, 0 = facing north, 90 = facing east) • What is the dominant land cover surrounding the site? • What is the dominant land use surrounding the site? • Describe land ownership surrounding the site • Tallest natural or man-made structures nearest to site (note exposure to surrounding terrain) • Distance to land features such as bodies of water (from lakes to oceans), canyons, etc. (note elevations) • Describe surrounding terrain features keeping the different landscape scales in mind
Site Questionnaire Sources (note distances, direction and activity levels) • Roads within 2 km (paved, unpaved, parking lots) • Structures within 2 km (residences/lodging, public and restricted access facilities) • Towns, cities or settlements • Industrial source areas and point sources • Agricultural areas • Seasonal anthropogenic sources • Disturbed vacant land • Distance to natural sources
Site Questionnaire Meteorology and Climatology • Surrounding surface meteorological stations; name of network; what parameters are collected? • Closest air quality station; name of network; what parameters are collected? • Describe generally how wind flow patterns are modified by various land features at difference scales • Describe diurnal differences in wind flows • Describe seasonal differences in wind flows, meteorological events (note fogs, snow, rain) • Could the site be influenced by inversions? • Any historical field study data?
Meteorological Networks Next task: Add capability to perform queries to the database using a search radius
Meteorological Conditions Database contains specific events and affect extinction
Linking conditions The database can assist in the identification of meteorological conditions based on a physical attribute
Draft Causes of Haze Website • Modeled after VIEWS website • Developed and managed at DRI • Possible URL http://coha.dri.edu
Test sites • Hawaii (Volcanic NP) • Denali NP • San Gorgonio WA • Upper Buffalo WA • Saguaro NP (both sites) • Big Bend NP • Mount Ranier NP • Grand Canyon (all sites) • Boundary Waters WA
Next Steps • Populate descriptive analysis database from existing data sources • Populate web site with test site • Publish draft web site on DRI web server • Incorporate new databases as they are made available (e.g. WRAP In/Near Emissions)