Bivariate Descriptive Analysis
Bivariate Descriptive Analysis. First step in analyzing your data Three components Cross-tabulations and frequency distributions Significance testing Correlations Initial look at how the data fits together and the relationships between the data

Bivariate Descriptive Analysis
E N D
Presentation Transcript
Bivariate Descriptive Analysis • First step in analyzing your data • Three components • Cross-tabulations and frequency distributions • Significance testing • Correlations • Initial look at how the data fits together and the relationships between the data • Always done before the regressions because lends a framework for the analysis
Crosstabs • Have already done in lab • What do they Mean? • Measure of how two variables and therefore two concept categories overlap/relate • Example white race versus poverty income may be 14% • African American versus poverty income may be 27% • Thus fewer whites live in poverty than African Americans BY THIS DATA
Data and Samples • Cannot assume that the data are representative • Need to be cautious about statements such as “this relates to that” in a certain way
Rates versus Raw numbers • Raw numbers do not reflect the relative strength of the relationships and should never be used in data explication • Rates are relative comparisons regardless of the numbers and better reflect relationships
General descriptives are valuable too • Mean • Median • Mode • Each for each variable—dependent and independent • General Idea of the distribution of each • Variance and Standard deviation
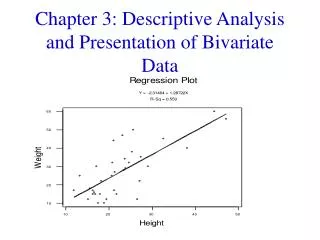
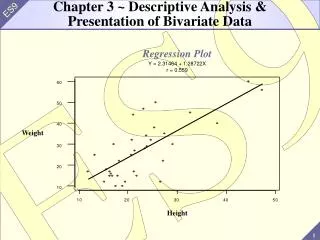
Graphs • Helpful only if they show a clear delineation or difference in the data
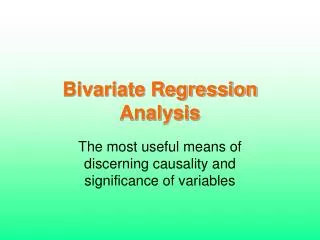
Descriptives versus Regressions • Descriptives are raw measures that do not give precision • Regressions give more precise relationships between independent and dependent variables • Can show those relationships CONTROLLING for other variables • Descriptives have no such controls
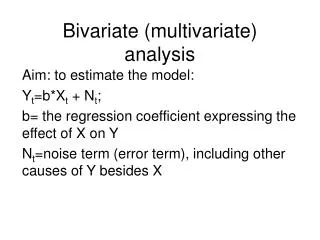
Correlations • Measures of association • Measures of the strength and direction of a relationship between two variables or concepts statistically • Need to know what kind of variable you have • Nominal, ordinal, scale
Nominal Correlations • Lambda • 0 to 1 • Zero means unrelated • 1 means completely overlapping (the same) • Usually in between • Which variables? All the dichotomous variables (ones and zeros) you just made • If comparing two nominals use lambda • DOES NO SHOW DIRECTION
Ordinals • Not applicable here • Comparison of two ordinal variables • Use Spearman’s Rho or Gamma • Gamma ranges from -1 to +1 • Shows direction and strength—larger number (-/+) then stronger relationship
Interval/Scale Variables • Need Mean, Variance, Range and Standard deviation as frequency measures • PRE concept • Association measures are r-squared and Pearson’s r • T-test and p value associations for significance • Very high r value means auto-correlation (the variables measure the same thing)
Nominal and Ordinal • Use Chi-square • If Scale or interval use T test for significance testing • These test difference and likeness • If not significant (p>0.05) then the concepts and the variables used are not arrayed differently and may not be significant to the regression
Chi-square • Lambda and Gamma issues • Need for ordinal and Nominal variables • If Lambda is zero (rare) the ONLY measure of association and significance that is valuable • Differences in Chi-square models will be discussed with regression models • Non-parametric measure of association and difference—compares two variables with know frequencies of distribution –does the data relate or not together?
Significance Testing • Defined as the likelihood that a relationship between two variables in a sample exists in the population the sample is designed to represent • Inference is the Strength of that relationship • Measures of Goodness of Fit—how do the parameters chosen fit together (well or not well)
Making Sense of This • Frequencies—what does the data say is the distribution of EACH of your variables • Crossatbulations—what are the relationships between sets of two of your variables, how do they cross relate • Association tests—are the two variables related in some way • Significance tests—what is the strength of that two-way relationship