Understanding Bivariate Regression Analysis: Causality and Variable Significance
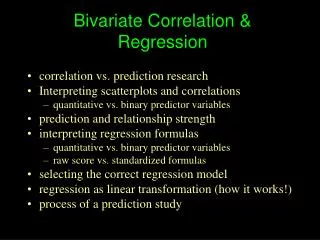
Bivariate regression analysis is a crucial statistical tool for deducing causality and variable significance. It serves multiple purposes, including testing causal hypotheses, making predictions from data samples, and assessing rates of change between variables. By drawing a regression line through data points, we can evaluate how an independent variable (X) predictably affects a dependent variable (Y). This analysis also yields insights into model fit via R-squared values and the statistical significance of relationships, helping in understanding both correlation and causation.

Understanding Bivariate Regression Analysis: Causality and Variable Significance
E N D
Presentation Transcript
Bivariate Regression Analysis The most useful means of discerning causality and significance of variables
Purpose of Regression Analysis • Test causal hypotheses • Make predictions from samples of data • Derive a rate of change between variables • Allows for multivariate analysis (multiple causes and control variables)
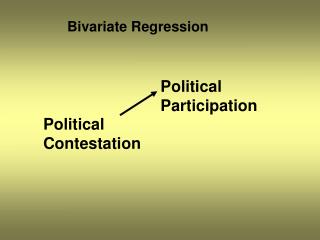
Goal of Regression • Draw a regression line through a sample of data to best fit. • This regression line provides a value of how much a given X variable on average affects changes in the Y variable. • The value of this relationship can be used for prediction and to test hypotheses and provides some support for causality.
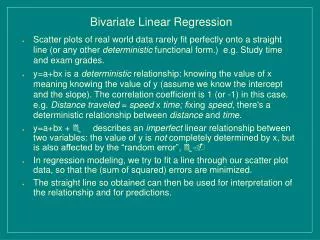
Perfect relationship between Y and X: X causes all change in Y Where a = constant or intercept (value of Y when X= 0 ; B= slope or beta, the value of X Imperfect relationship between Y and X E = stochastic term or error of estimation and captures everything else that affects change in Y not captured by X
The Intercept • The intercept estimate (constant) is where the regression line intercepts the Y axis, which is where the X axis will equal its minimal value. • In a multivariate equation (2+ X vars) the intercept is where all X variables equal zero.
The Intercept The intercept operates as a baseline for the estimation of the equation.
The Slope: B coefficient • The slope estimate equals the average change in Y associated with a unit change in X. • This slope will not be a perfect estimate unless Y is a perfect function of X. If it was perfect, we would always know the exact value of Y if we knew X.
Model Fit: Coefficient of Determination • R squared is a measure of model fit. Explains power of X variables to predict Y. R2 explains variation in Y. • If R2 equals 1.0 then X variables predict perfectly, if it equals zero then no explanatory power. • Ranges 1 to 0. The higher the R2 the better the model.
Significance of Variables • We can also estimate whether certain variables are important. We do this by ascertaining statistical significance. • Our key question is: What is the probability that an estimate is produced by random chance and there is no relationship between X and Y variables?
Significance of Variables • We measure statistical significance by the probability that what we are observing is wrong (generated by random chance). • A significance level of .05 is conventional. This means that if the significance level is .05, there is a 5 percent chance that our results were generated randomly. A .01 level means there is a 1 percent chance.
Interpreting a Bivariate Regression • The prior table shows that with an increase in unemployment of one unit (probably measured as a percent), the S&P 500 stock market index goes down 69 points. • Also, the chance that this result is produced by random chance is less than one in 1,000.
Interpreting a Bivariate Regression Here, R is the correlation of the two variables and R2 the measure of model fit. Model Fit: 37.8% of variability of Stocks predicted by change in unemployment figures.
Interpreting a Regression 2 • What can we say about this relationship regarding the effect of X on Y? • How strongly is X related to Y? • How good is the model fit?
Interpreting a Regression 2 • The correlation between X and Y is weak (.133). This is reflected in the bivariate correlation coefficient but also picked up in model fit of .018. What does this mean? • However, there appears to be a causal relationship where urban population increases democracy, and this is a highly significant statistical relationship (sig.= .000 at .05 level)
Interpreting a Regression 2 • Yet, the coefficient 4.176E-05 means that a unit increase in urban pop increases democracy by .00004176, which is miniscule! • This model teaches us a lesson: We need to pay attention to both matters of both statistical significance but also matters of substance. In the broader picture urban population has a rather minimal effect on democracy.
The Inference Made • As with some of our earlier models, when we interpret the results regarding the relationship between X and Y, we are making an inference based on a sample drawn from a population. The regression equation for the population uses different notation: Yi = α + βXi + εi