Bivariate regression
Dive into the fundamentals of bivariate regression, including key concepts like the slope formula and explained variance. Learn how the slope indicates the relationship between variables, and discover how to analyze residuals. We explore the regression equation and bivariate relationships, emphasizing the importance of estimating expected values. Through practical examples, understand the impact of variables on predicted outcomes and the significance of substantive effects in various contexts, such as policy liberalism and education.

Bivariate regression
E N D
Presentation Transcript
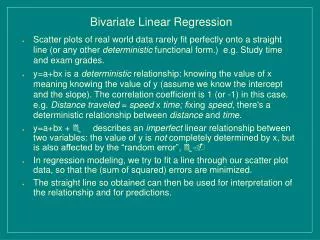
Bivariate regression The slope, explained variance, residuals
What is the formula for a slope? • A. e = mc2 • B. Yi = a + bxi + ei • C. ŷ = a + bx • D. y ≥ x ≥ a
What information does the slope provide? • A. whether the relationship is statistically significant • B. whether a case is a severe outlier, like Buchanan’s share of the vote • C. on average, what is the predicted value of y, given various values of x • D. which baseball batter is likely to hit best in the next game
What is a? • A. the y intercept • B. the value of y when x = 0 • C. where the slope crosses the y a axis • D. all of the above
Bivariate Relationships Plotting a Line
Review: Covariance • When it tends to be the case that x is greater than the mean when y is greater than the mean AND x is lower than the mean when y is lower than the mean, then there is a positive covariation
Expected value • But we may want to know more specific knowledge than that – we may want to know the expected value of y for each increased value of x • I may know the mean of everyone’s height in class • But if I know gender, then I can generate two expected values • If you remember, we are always trying to do better than the mean
Substantive effect • For every 10K dollars given in humanitarian aid, there is an increase in 3K spent on weapons • For every 10K dollars given in humanitarian aid, there is a .5K increase spent on weapons • For every 10K dollars given in humanitarian aid, there is a 8K increase spent on weapons • Unit of analysis?
Regression equation • y = a + bx + e • ŷ = a + bx • ŷ is also known as yhat • y is the dependent variable value • yhat is the predicted value • a is the intercept
X and Y • Y X • 2 1 • 2 • 4 3 • 3 4 • 6 5 • 5 6
X and Y • Y X • 2 1 • 2 • 4 3 • 3 4 • 6 5 • 5 6
Theory Living in an urban area allows better access to prenatal care.
Output Source SS df MS Number of obs = 41 F( 1, 39) = 9.09 Model 860.523694 1 860.523694 Prob > F = 0.0045 Residual 3693.55683 39 94.7065855 R-squared = 0.1890 Adj R-squared = 0.1682 Total 4554.08053 40 113.852013 Root MSE = 9.7317 prenatalcarepctCoef. Std. Err. t P>t [95% Conf. Interval] urbanpctoftotal.2517241 .083509 3.01 0.005 .0828111 .4206371 _cons 76.35186 4.367962 17.48 0.000 67.51682 85.18689
ŷ= a + bx • b is slope – rise over run • a is the y intercept; constant • Standard error is the average error from the actual points to the slope • T is the ratio of the slope divided by the standard error • Beta = Pearson r in bivariate analysis
Occupational Prestige and Education Dependent Variable: perceived prestige of occupation
Policy Liberalism and Public Opinion (Erikson, Wright & McIver, 1987) Q: Where does the diagonal line come from?
Extending Interval Correlations • Regression and correlation are intimately related concepts. • You’ve probably all tried to map lines in Cartesian spaces before…
Policy Liberalism and Public Opinion (Erikson, Wright & McIver, 1987) Q: Where does the diagonal line come from?
Mean of Votes Mean of Seats
The Regression Line Seats = -80.32 + 2.53*Votes
Estimating the magnitude of the effect from the slope • Find the range of x • (x may vary from 0-4, 1-5, 0-100000) • Multiply the range by the slope to find the effect of change in y, going from the lowest value of x to the highest value of x • If x ranges from 0-4, the range is 4 • If the slope is .25, the magnitude of the effect is 1