Download
1 / 9
100 likes | 306 Vues
BIVARIATE DATA: CORRELATION AND REGRESSION. Two variables of interest: X, Y. GOAL: Quantify association between X and Y: correlation. Predict value of Y from the value of X: regression.

E N D
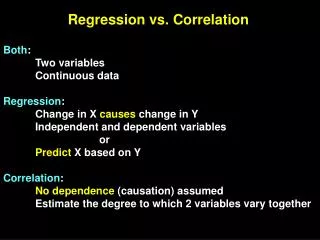
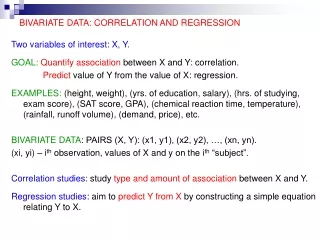
BIVARIATE DATA: CORRELATION AND REGRESSION Two variables of interest: X, Y. GOAL:Quantify association between X and Y: correlation. Predict value of Y from the value of X: regression. EXAMPLES: (height, weight), (yrs. of education, salary), (hrs. of studying, exam score), (SAT score, GPA), (chemical reaction time, temperature), (rainfall, runoff volume), (demand, price), etc. BIVARIATE DATA: PAIRS (X, Y): (x1, y1), (x2, y2), …, (xn, yn). (xi, yi) – ith observation, values of X and y on the ith “subject”. Correlation studies: study type and amount of association between X and Y. Regression studies: aim to predict Y from X by constructing a simple equation relating Y to X.
CORRELATION GRAPHICAL REPRESENTATION OF BIVARIATE DATA – SCATTER PLOT: plot observations (x1, y1), (x2, y2), …, (xn, yn) as points on the plane. Types of association/relationship between vars: positive, negative, none. Positive association: Two variables are positively associated if large values of one tend to be associated (occur) with large values of the other variable and small values of one tend to be associated with small values of the other variable. Positive association Example: Height and weight are usually positively associated
CORRELATION, contd. Negative association: Two variables are negatively associated if large values of one tend to be associated (occur) with small values of the other. The variables tend to “move in opposite directions”. No association: If there is no association, the points in the scatter plot show no pattern. Negative association No association E.g. High demand often occurs with low price.
CORRELATION COEFFICIENT Measure of strength of association: correlation coefficient: rxy. Data: (x1, y1), (x2, y2), …, (xn, yn). Sample statistics: sample means: Sample standard deviations: sx and sy. Sample correlation coefficient: Correlation coefficient measures strength of LINEAR association.
PROPERTIES OF THE SAMPLE CORRELATION COEFFICIENT rXY. • rxy> 0 indicates positive association between X and Y. • rxy < 0 indicates negative association between X and Y. • rxy≈ 0 indicates no association between X and Y. • -1 ≤ rxy ≤ 1, the closer | rxy | to 1, the stronger the relationship between X and Y. • Computational formula for r: given sample stats we can compute r as
CORRELATION COEFFICIENT AND ASSOCIATION Moderate association Strong association r = 0.9 r = 0.75 r = 0.5 Weak association No association Almost perfect association, but not linear, r small. r = 0.28 r = - 0.3
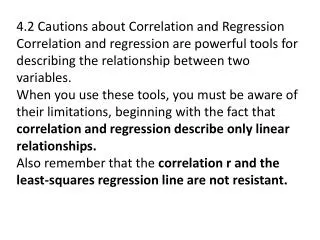
CORRELATION, CONTD. • Correlation does not imply CAUSATION! • Watch out for hidden (lurking) variables. Example. Study of fires. X=amount of damage, Y = # of firefighters. rXY≈0.85. The more firefighters, the more damage? Hidden variable: Size of the fire.
EXAMPLE income savings 25 0.5 28 0.0 35 0.8 39 1.6 44 1.8 48 3.1 52 4.3 65 4.6 55 3.5 72 7.2 In a study of income an savings, data was collected from 10 households. Both savings and income are reported in thousands of $ in the following table. Find the correlation coefficient between income and savings. Solution: Summary statistics: X=income, Y=savings Σxi = 463 , Σx2i = 23533, Σyi = 27.4 , Σy2i = 120.04 , Σxi yi =1564.4. There is a strong positive association between family income and savings.
EXAMPLE, MINITAB Correlations (Pearson) Correlation of income and savings = 0.963, P-Value = 0.000