Correlation and Regression
Correlation and Regression. Research Process and Design Spring 2006 Class #12 (Week 14). Today’s objectives. To discuss proposal drafts To briefly describe chi-square To explore correlation, partial correlation, and regression. Using Chi-square to test for sample representativeness.

Correlation and Regression
E N D
Presentation Transcript
Correlation and Regression Research Process and Design Spring 2006 Class #12 (Week 14)
Today’s objectives • To discuss proposal drafts • To briefly describe chi-square • To explore correlation, partial correlation, and regression Research Process and Design (Umbach)
Using Chi-square to test for sample representativeness • Chi-square tests for statistically significant differences between the observed and expected (or theoretical) frequencies • When conducting a study, you may want to see if your sample is different than your population on key characteristics (e.g., race, gender, socio-economic status) Research Process and Design (Umbach)
fo=observed frequency fe=expected frequency Degrees of freedom=# of rows-1 • Each and every observation must fall into only one category • Each observation must be independent of the others • Sample N must be large Research Process and Design (Umbach)
Correlational research • Bivariate correlation • Partial correlation • Prediction (regression) Research Process and Design (Umbach)
Correlation Coefficient Properties of correlation coefficient: • A “standardized” measure of relationship that ranges between -1 and +1 • Positive: 0 < r +1 • Negative: -1 r < 0 • No correlation: r = 0 • Stronger relationship as r moves away from zero Research Process and Design (Umbach)
Limitations • Weak correlations are less useful for making inferences • Correlations vary across factors, so it is difficult to compare across factors (e.g., stock prices and faculty salaries) • May be multiple factors affecting a single factor of interest • Does not measure non-linear relationships Research Process and Design (Umbach)
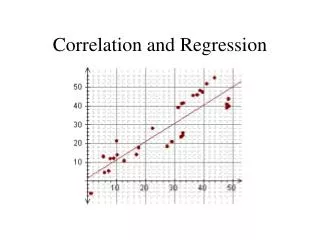
Correlation – Pearsons r Research Process and Design (Umbach)
Relationship between college attendance and critical thinking College Attendance b Critical Thinking (’02) c Research Process and Design (Umbach)
Partial Correlation College Attendance b Critical Thinking (’02) c Critical Thinking (‘01) a Research Process and Design (Umbach)
Partial Correlation College Attendance b Critical Thinking (’02) c Critical Thinking (‘01) a Research Process and Design (Umbach)
Partial Correlation Research Process and Design (Umbach)
Linear Regression (“OLS”) • Objective: find the best linear (“straight line”) relationship between two or more variables. • Ordinary Least Squares (OLS) is the technique most often used to choose the best line. • This linear relationship is based on the relationship between two variables – with the dependent variable being a continuous measure (interval or ratio). • Regression analysis requires the analyst to specify the direction of causation. Research Process and Design (Umbach)
Ordinary Least Squares Research Process and Design (Umbach)
Linear regression • Attempt to draw the line of best fit • a and b often called regression coefficients or constants Where Y’=criterion variable b=slope a=intercept Research Process and Design (Umbach)
If X=10 then Y’=(.181*10)+1.39=3.2 Research Process and Design (Umbach)
Advantages of Linear Regression: • Can predict/forecast one variable (Y) based on values of another variable (X) • Can perform hypothesis tests to determine if X affects Y • Can control for differences in Y due to X • Very flexible with regard to functional form, model specification, etc. Research Process and Design (Umbach)
Goodness of Fit • Measures the strength of the relationship between X and Y • R-squared (or coefficient of determination): proportion of total deviation in Y that is “explained” by X(s) • R-squared is bounded between 0 and 1 (R2 = 1 if perfect fit, R2 = 0 if no fit) • R-squared = square of correlation coefficient (with only one X variable in the model) Research Process and Design (Umbach)
More on R-squared... • When there is no covariance, the slope of the regression line is zero and R2 = 0. • Adding variables to the regression model will almost always raise R2, but this does not mean that the resulting model is “better” • Adjusted R2 attempts to correct for this, but no longer has the same interpretation • R2 varies depending on the dependent variable. Do not use this to compare regression models with different Y’s. Research Process and Design (Umbach)
Class Example #2 Using the data file from our earlier exercise, in SPSS: • Calculate a regression line showing how time spent studying math affects math grades Research Process and Design (Umbach)
Output Research Process and Design (Umbach)
Output (cont’d) Equation: Grades = 2.814 + 0.088*Time reading Research Process and Design (Umbach)
Hypothesis Testing for β • In most situations in the social sciences, it is rarely known for sure if X affects Y • A hypothesis test can be used to determine if the data provide sufficient evidence of a relationship • For most variables, the sample slope ‘b’ will not exactly equal zero. How far from zero must it be in order to safely conclude that β 0?? Research Process and Design (Umbach)
Steps in Hypothesis Testing • Specify null (H0) and alternative (HA) hypotheses • Identify test statistic and find critical value(s) based on degrees of freedom and significance level • Calculate test statistic and compare to critical value(s) Research Process and Design (Umbach)
Common Hypotheses for β • β = 0 (X has no effect on Y) • β > 0 (X has a positive effect on Y) • β < 0 (X has a negative effect on Y) • β 0 (X has some effect on Y…+ or - ) Choose two hypotheses that are mutually exclusive and exhaustive. The null hypothesis (H0) should always contain some form of equal sign. Research Process and Design (Umbach)
Notes on Hypothesis Testing • The t-ratio simply counts the # standard deviations the slope is from zero (“distance”) • The greater the distance, the less likely you would have found the value of b if β = 0. • For significance tests, since β = 0, the t-ratio is the slope divided by its standard deviation (or “standard error”) Research Process and Design (Umbach)
Units of Measurement The significance levels of any variable will not be influenced by the units of measure used for X or Y • The coefficient represents the # units change in Y due to a one-unit change in X • When the units of measure change, both the coefficients and standard errors change proportionately (t-ratio remains the same) Research Process and Design (Umbach)
Dummy Variables • Binary variables (often coded using 0 and 1) • Can be used in correlational procedures • Easy when you have 2 groups • Females=1, Males=0 • Aggressive Cartoon=1, Non-agressive cartoon=1 • With three or more groups, need to use multiple variables and omit one (reference group) in regression • White=1, all others=0 • African American=1, all others=0 • Asian Pacific American=1, all others=0 • etc. Research Process and Design (Umbach)
For next week… • Understanding regression • Readings: • *Allison (1998) – Ch. 1 • Select ONE of the following: • *Bellas (1994) • *Perna (2003) • Three groups will present Research Process and Design (Umbach)