Bivariate Linear Regression July 14, 2008
Bivariate Linear Regression July 14, 2008. Ivan Katchanovski , Ph.D. POL 242Y-Y. Bivariate Linear Regression . Linear Regression: Statistical technique of finding association between variables and testing research hypotheses Widely used in political science research

Bivariate Linear Regression July 14, 2008
E N D
Presentation Transcript
Bivariate Linear RegressionJuly 14, 2008 Ivan Katchanovski, Ph.D. POL 242Y-Y
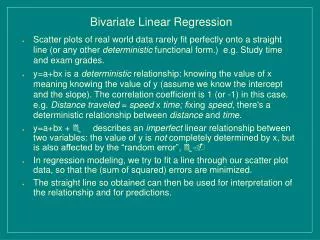
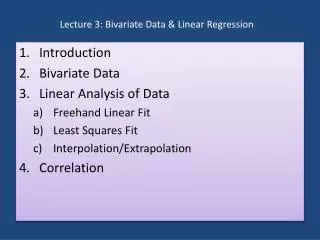
Bivariate Linear Regression • Linear Regression: Statistical technique of finding association between variables and testing research hypotheses • Widely used in political science research • Originally concerned regression of height toward the population mean (Galton and eugenics) • Assumes linear relationship • Bivariate Regression: Association between two variables at interval-ratio level • Can be used for ordinal variables with certain assumptions
Bivariate Linear Regression Formula • Regression Formula: Y = a + bX • Y = the value of the dependent variable • a = the Y intercept, or the value of Y when X = 0 • b = the regression coefficient, the slope of the regression line, or the amount of change produced in Y by a unit change in X • Positive sign of regression coefficient: positive direction of association • Negative sign of regression coefficient: negative direction of association • X = the value of the independent variable
R Square: Coefficient of Determination • R Square: Proportion of the variation in the dependent variable (Y ) that is explained by the independent variable (X) • R square=Explained variation/Total variation • R square=Correlation coefficient (r) squared • Ranges between 0 (no association) and 1 (perfect association)
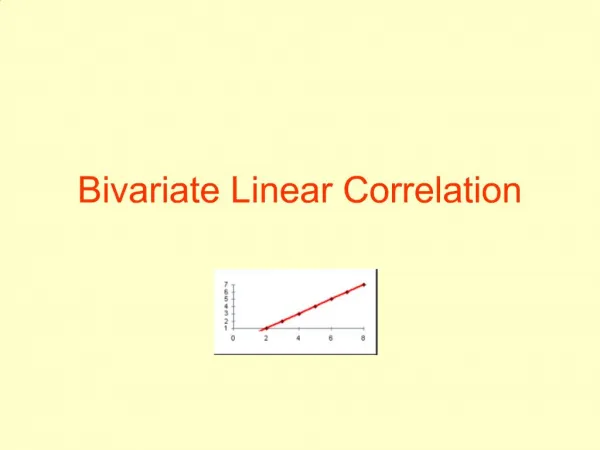
Regression Line Regression line: The best-fitting straight line that summarizes the relationship between two variables
Statistical Significance • Statistical Significanceof Regression Coefficient (b): • Statistically significant if in SPSS p(obtained)<p(critical)=.05 or .01 or .001 • Statistically nonsignificant if SPSS p(obtained)>p(critical)=.05 • Direction of association should be reported only for statistically significant regression coefficients
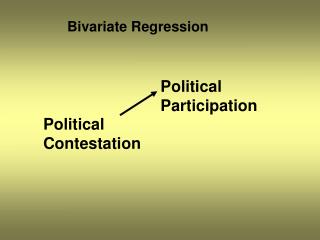
Example • Research hypothesis: The level of economic development has a positive effect on civil liberties in countries of the world • Dependent variable: civil liberties • Interval-ratio • Independent variable: GDP per capita ($1000) • Measure of the level of the economic development • Interval-ratio
Example • Regression Coefficient=.257 • Increase of $1000 in the level of GDP per capita increases the civil liberties score by .257 • Statistical significance of the regression coefficient: • SPSS: p(obtained)=.000 <p(critical)=.001=.1% • Statistically significant at the .001 or .1% level • R square=.525 • GDP per capita explains 52.5% of variation in civil liberties • Research hypothesis: supported by bivariate regression analysis • The level of economic development has a positive and statistically significant effect on civil liberties