Bivariate Linear Regression
Bivariate Linear Regression. Linear Function. Y = a + bX +e. Sources of Error. Error in the measurement of X and or Y or in the manipulation of X. The influence upon Y of variables other than X (extraneous variables), including variables that interact with X.

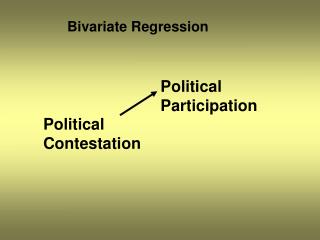
Bivariate Linear Regression
E N D
Presentation Transcript
Linear Function Y = a + bX +e
Sources of Error • Error in the measurement of X and or Y or in the manipulation of X. • The influence upon Y of variables other than X (extraneous variables), including variables that interact with X. • Any nonlinear influence of X upon Y.
The Regression Line • r2 < 1 Predicted Y regresses towards mean Y • Least Squares Criterion:
Pearson r is a Standardized Slope • Pearson r is the number of standard deviations that predicted Y changes for each one standard deviation change in X.
Error Variance • What is SSE if r = 0? • If r2 > 0, we can do better than just predicting that Yi is mean Y.
Standard Error of Estimate • Get back to the original units of measurement.
Regression Variance • Variance in Y “due to” X • p is number of predictors. • p = 1 for bivariate regression.
Coefficient of Determination • The proportion of variance in Y explained by the linear model.
Coefficient of Alienation • The proportion of variance in Y that is not explained by the linear model.
Testing Hypotheses • H: b = 0 • F = t2 • One-tailed p from F = two-tailed p from t
Source Table • MStotal is nothing more than the sample variance of the dependent variable Y. It is usually omitted from the table.
Power Analysis • Using Steiger & Fouladi’s R2.exe
Summary Statement The linear regression between my friends’ burger consumption and their beer consumption fell short of statistical significance, r = .8,beers = 1.2 + 1.6 burgers, F(1, 3) = 5.33, p = .10.The most likely explanation of the nonsiginficant result is that it represents a Type II error. Given our small sample size (N = 5), power was only 13% even for a large effect (ρ = .5).
Increase n to 10 • Same value of F • r2 = SSregression SStotal, = 25.6/64.0 = .4 (down from .64).
Increase n to 10 A .05 criterion of statistical significant was employed for all tests. An a priori power analysis indicated that my sample size (N = 10) would yield power of only 33% even for a large effect (ρ = .5). Despite this low power, the analysis yielded a statistically significant result. Among my friends, beer consumption increased significantly with burger consumption, r = .632,beers = 1.2 + 1.6 burgers, F(1, 8) = 5.33,p = .05.
Testing Directional Hypotheses • H: b 0 H1: b > 0 • For F, one-tailed p = .05 • half-tailed p = .025. • P(AB) = P(A)P(B) = .5(.05) = .025
Assumptions • To test H: b = 0 or construct a CI • Homoscedasticity across Y|X • Normality of Y|X • Normality of Y ignoring X • No assumptions about X • No assumptions for descriptive statistics (not using t or F)
Placing Confidence Limits on Predicted Values of Mean Y|X • To predict the mean value of Y for all subjects who have some particular score on X:
Placing Confidence Limits on Predicted Values of Individual Y|X
Testing Other Hypotheses • Is the correlation between X and Y the same in one population as in another? • Is the slope for predicting Y from X the same in one population as in another? • Is the intercept for predicting Y from X the same in one population as in another.