MHA 6350 Bivariate Analysis
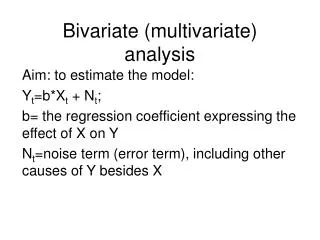
MHA 6350 Bivariate Analysis. Correlation and Linear Regression Dr. Burton. Correlation. Pearson product-moment correlation coefficient, given symbol r The r value varies from –1 to +1 Tests significance of two continuous variables. A perfect positive correlation (+1.00). 10 9 8 7

MHA 6350 Bivariate Analysis
E N D
Presentation Transcript
MHA 6350Bivariate Analysis Correlation and Linear Regression Dr. Burton
Correlation • Pearson product-moment correlation coefficient, given symbol r • The r value varies from –1 to +1 • Tests significance of two continuous variables
A perfect positive correlation (+1.00) 10 9 8 7 6 5 4 3 2 1 X Y 20 10 18 9 16 8 14 7 12 6 10 5 8 4 6 3 4 2 2 1 Y 0 2 4 6 8 10 12 14 16 18 20 X
A perfect negative relationship (-1.00) 10 9 8 7 6 5 4 3 2 1 X Y 20 0 18 1 16 2 14 3 12 4 10 5 8 6 6 7 4 8 2 9 Y 0 2 4 6 8 10 12 14 16 18 20 X
A high positive relationship (.87) 20 18 16 14 12 10 8 6 4 2 X Y 20 12 18 16 16 10 15 14 14 12 12 10 12 9 10 8 8 7 5 2 Y 0 2 4 6 8 10 12 14 16 18 20 Homoscedasticity X
A low negative relationship (-.31) 10 9 8 7 6 5 4 3 2 1 X Y 20 10 18 9 16 8 14 7 12 6 10 5 8 4 6 3 4 2 2 1 Y 0 2 4 6 8 10 12 14 16 18 20 X
10 9 8 7 6 5 4 3 2 1 Y 0 1 2 3 4 5 6 7 8 9 10 X A curvilinear regression X Y 10 1 9 2 8 3 7 4.5 6 4.5 5 4 4 4 3 3 2 2 1 1
(xi - x) (y i- y) R = ------------------- = ---------------- (x - x)2 (y i- y)2 = ------------ 456.9 475.5 = ----- Box 11-1 p.142 (Pearson correlation coefficient) n = 8 (xi) = 1371.0 cm 456.9 (yi) = 492.2 kg (393.1)(575.1) x = 1364.0/8 = 170.5 cm y = 492.2/8 = 61.5 kg 456.9 = 0.96 (xi - x) (y i- y)= 456.9 kg 226,071.8 (x - x)2 = 393.1 (y i- y)2 = 575.1 R2 = (0.96) 2 = 0.92 = 92%
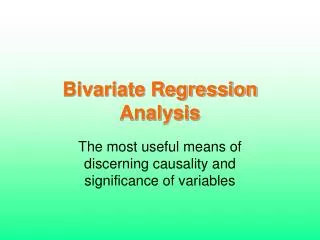
SXY - nXY b = SX2 - nX2 S (X - X)(Y - Y) OR b = S (X - X)2 a= Y - bX Linear Regression • Related to Correlation analysis • The formula for a straight line: y = a + bx b is the slope a is the y-intercept
Patients 6158575451484542393633 Y 0 1 2 3 4 5 6 7 8 9 10 Years X
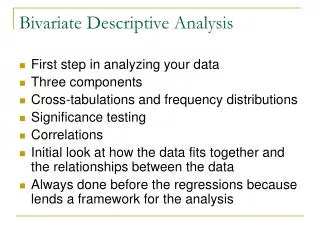
2,900 - (10)(5.5)(47.8) = 385 - (10) (5.52) a= Y - bX= 47.8 - (3.28)(5.5) Linear Regression con’t Mean X = 5.5 Mean Y = 47.8 SXY - nXY b = = 3.28 SX2 - nX2 = 29.76 Y = a + bX (X = 11): Y = 29.76 + (3.28)(11) = 65.8 (X = 12): Y = 29.76 + (3.28)(12) = 69.1 (X = 13): Y = 29.76 + (3.28)(13) = 72.4
Y = 29.76 73 70 67 64 6158575451484542393633 Patients (X = 5): Y = 29.76 + (3.28)(5) = 46.16 (X = 1): Y = 29.76 + (3.28)(1) = 33.04 Y 0 1 2 3 4 5 6 7 8 9 10 11 12 13 X
Seasonal Variation Suntan Oil Sales 150 100 50 J F M A M J J A S O N D J F M A M J J A S O N D J F M A M J J A