Download

1 / 31
310 likes | 453 Vues
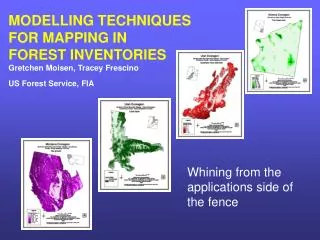
MODELLING TECHNIQUES FOR MAPPING IN FOREST INVENTORIES Gretchen Moisen, Tracey Frescino US Forest Service, FIA. Whining from the applications side of the fence. Outline. Need for new info Data Models 4. Maps and applications 5. Now what. Need for new information: Traditional reports.

E N D
MODELLING TECHNIQUES FOR MAPPING IN FOREST INVENTORIESGretchen Moisen, Tracey FrescinoUS Forest Service, FIA Whining from the applications side of the fence
Outline • Need for new info • Data • Models 4. Maps and applications 5. Now what
Need for new information:Traditional reports • Inventory status and trends in forested ecosystems nationwide 1928 McSweeney-McNary Act 1978 Renewable Resources Act 1998 Farm Bill • Regional estimates of forest area, tree volume, growth and mortality
Research to develop new products……… In addition to estimates of population totals……. • Make maps! Show how forest resources are distributed throughout the landscape • Use those maps: wildlife, fire, harvest…. • Automate data retrieval, visualization, and analysis tools • Build web-based delivery systems • Just do it
QUESTIONS FIELD DATA DIGITAL DATA MODELS EVALUATION DELIVERY Need for new information:Development of an interdisciplinary system • Dialogue with users, define problems • Build data base, prepare data • Build and test models • Test products in real applications • Get it out and get feedback
Outline • Need for new info • Data • Models 4. Maps and applications 5. Now what?
DataSix Ecoregions • Regional diversity • Forested ecoregions • Within state bounds • Sample across all owners
Data:Plot-level Response Variables Continuous: • Basal area • Biomass • Crown cover • Growth • QMD • Stand age • TPA • Volume • Catagorical: • Forest/nonforest class • Select forest type
Data: Sample plots MT1 (F: 1277 NF: 294) MT2 (F: 1612 NF: 2108)
Process:Many RS-based Predictor Variables • Raw imagery: TM, MODIS, AVHRR • NLCD 30 m resolution 19 classes, 8 broad groups • DEMs: elevation, aspect, slope, hillshade, topographic class • Spatial coordinates • Other: Soils, TEUs, Precip
Outline • Need for new info • Data • Models 4. Maps and applications 5. Now what?
Models:Establishing relationships with predictors • Extract data from each layer at each FIA location • Build a model for each FIA variable Example: Tree cover ~ f(Cover-type, Elev, Aspect, Slope)
Models:Predicting over large areas Through the final model, use ………cover type ……….elevaton ……….aspect ……….slope to predict ……….crown cover over unsampled areas
Models Response discrete x continuous x interactions Forest type Basal area Biomass Crown cover Growth QMD Age TPA Volume NLCD Soils Elevation Aspect Slope Hillshade X Y X,Y Elev, Asp, Slope NLCD(others)
Models:SimpleBenchmarks • Discrete variables Yhat=NLCD class • Continuous variables Yhat=mean(Y) w/i NLCD classes • SIMPLE..is it enough?
Numerous model building tools….. GAM CART MARS ANN
Model Test Using Simulated Data CART LM X1,…, X10 ~ Unif(0,1) Y = 2sin(π*X1*X2) + .4(X3-.5)2 + .2(X4) + .1(X5) GAM MARS ANN
Residual Plots: BIOTOT in UT2 NLCD CART GAM MARS ANN
Outline • Need for new info • Data • Models 4. Maps and applications 5. Now what?
Building maps: F/NF, BA, CRCOV, VOL, STAGE, QMD
Fishlake Applications Build and test large-scale models predicting… - Presense of cavity nesting birds - Elk calving sites …using FIA-generated maps of habitat predictor variables Tom Edwards, Randy Schultz
Applications:Web Delivery • JPEG preview • PDF map • Build a map • (Generate a map • based on • user-defined • criteria) • Tracey Frescino, • Frank Spirek Warning: These maps are prototypes under development. They are NOT final products http://www.fs.fed.us/rm/ogden/index.html ► Techniques Research
Applications: Interactive Display Environment • Interactive tool for visualize, summarize, and query resource information • Tracey Frescino
Outline • Need for new info • Data • Models 4. Maps and applications • Now what?
QUESTIONS FIELD DATA DIGITAL DATA MODELS EVALUATION DELIVERY Future Work:Refining Interdisciplinary System • Continue dialogue • Refined retrieval system • New predictor variables • Streamlined modeling box • NFS test applications • Refined web-based delivery
Future Work:New Applications • Prediction for new applications: assessment of resources lost to wildfire or I&D, extension to other wildlife species • Improved precision on population estimates • Improved analyses