Download

1 / 171
1.73k likes | 2.21k Vues
Energy and the New Reality, Volume 2: C-Free Energy Supply Chapter 4: Biomass Energy L. D. Danny Harvey harvey@geog.utoronto.ca. Publisher: Earthscan, UK Homepage: www.earthscan.co.uk/?tabid=101808.

E N D
Energy and the New Reality, Volume 2:C-Free Energy SupplyChapter 4: Biomass EnergyL. D. Danny Harveyharvey@geog.utoronto.ca Publisher: Earthscan, UKHomepage: www.earthscan.co.uk/?tabid=101808 This material is intended for use in lectures, presentations and as handouts to students, and is provided in Powerpoint format so as to allow customization for the individual needs of course instructors. Permission of the author and publisher is required for any other usage. Please see www.earthscan.co.uk for contact details.
From the Summary For Policymakers of the WG1 Report for the IPCC 5th Assessment Report
Table of agreements and disagreements among bioenergy experts
Global use of different energy sources for residential and commercial buildings in 2010 Source: International Energy Agency, Energy Balances Reports for 2010
Figure 4.1 Uses of biomass for energy in 2007. Overall contribution: about 10% of total primary energy supply. Source: Sims (2010, in Industrial Crops and Uses, CABI, Wallingford, UK)
Figure 4.2a Trends in biomass use by type, with uncertainty bars for the total
Advantages of biomass: • Can be stored • Provides rural income & employment • Potentially cleaner than coal for most pollutants • Can be irrigated and fertilized with sewage water • Can be cultivated in such a way as to improve the landscape and remediate soils • Can make use of animal wastes and agricultural residues while providing an effective fertilizer byproduct
Disadvantages of biomass energy • Land intensive (efficiency of photosynthesis is ~ 1%, with further losses when biomass is converted to secondary forms of energy) • Can compete with land for food • Complex to initiate and manage • Must be tailored to the biophysical and socio-economic circumstances of each region
Comparison with fossil fuels • Heating value ranges from 14 GJ/t (sugar cane, straw) to 18-20 GJ/t (air-dried wood), compared to 28-31 GJ/t for coal • This makes biomass bulky and more expensive to transport (in both dollar and energy terms) than coal
Table 4.3: Biomass energy resource categories Source: Hoogwijk (2003, Biomass and Energy, 25, 119-133)
Bioenergy Crops • Annuals • Perennial grasses • Woody Crops (trees)
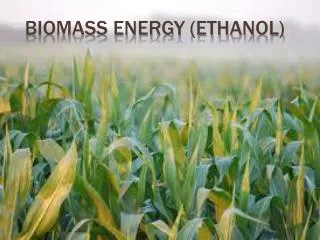
Annuals • Starch-rich crops (maize (corn), wheat, potatoes) (used to produce ethanol) • Sugar-rich crops (sugarcane, sugar beets) (used to produce ethanol) • Oil-rich crops (coconut oil, palm oil, sunflower oil) (used to produce biodiesel)
Figure 4.3a Sugarcane (a sugar-rich crop) Source: www.wikipedia.org
Figure 4.3b Sugarcane harvesting Source: www.wikipedia.org
Figure 4.3c Cut sugarcane stalks Source: www.wikipedia.org
Figure 4.4 Palm oil (and oil-rich crop) Sources: Left, Photo by Jeff McNeely in Howarth and Bringezu (2009, Biofuels: Environmental Consequences and Interactions with Changing Land Use, SCOPE); upper right, Stone (2007, Science, vol 317, pp149 ); lower right, Koh and Wilcove (2007, Nature, vol 448, pp993–994)
Perennial grasses • Switchgrass (Panicum virgatum)(native to North America) • Miscanthus (native to tropical Africa and tropical and temperate Asia) • Napier grass (native to tropical Africa) • Jatropha curcas (a poisonous weed native to Central America, used in India)
Figure 4.5 Switchgrass (Panicum virgatum) Source: US Gov public domain
Figure 4.6 Miscanthus sinensus (upper)& Napier grass (Pennisetum pupureum) (lower) Source: www.wikipedia.org
Figure 4.7 Close-up of Jatropha (left), anddegraded land before (upper right) and after being planted with Jatropha (lower right) in India Source: Left, photo by Jeff McNeely in Howarth and Bringezu (2009, Biofuels: Environmental Consequences and Interactions with Changing Land Use, SCOPE); right, Fairless (2007, Nature, vol 449, pp652–655)
Woody crops • Short-rotation coppicing - Willow (Salix) - Poplar (Populus) • Modified conventional forestry - Acacia (N-fixing) - Pine (Pinus) - Eucalyptus
Figure 4.8 Harvest of coppice willow and irrigation of new growth with sewage water in Sweden. Source: Dimitriou and Aronsson (2003, Unasylva 56, 221, 47-50)
Figure 4.9a Five-year old Acacia plantation Source: Doug Maquire, Oregon State University, www.forestryimages.org
Figure 4.9b Eucalyptus plantation in Spain (left) and 4-year old Eucalyptus in Hawaii (right). Source: NREL Photo Exchange, www.nrel.gov/data/pix)
Figure 4.9c 14-year old loblolly pine (Pinus taeda) in Georgia, USA Source: Dennis Haugen, www.forestryimages.org
Yields of bioenergy crops • Annuals - Sunflower 1.5 t/ha/yr - Maize: 4 t/ha/yr - Sugarcane, sugar beet: 60 t/ha/yr • Grasses - Jatropha: 10-15 t/ha/yr - Miscanthus 10-15 t/ha/yr - Switchgrass 10-25 t/ha/yr - Napier grass 30 t/ha/yr • Trees - Loblolly pine: 4-5 t/ha/yr - Poplar, willow: 10-20 t/ha/yr - Eucalyptus: 10-50 t/ha/yr
Agricultural Residues • A variety of residues (stalks, shells, husks, leaves) from a wide variety of crops (such as coconut, maize, cotton, groundnuts, pulses, rice, sugarcane) are produced and used for household energy use in rural areas of developing countries already • Straw is co-fired with coal in Denmark • Bagasse is a fibrous residue produced during the processing of sugarcane into sugar
Figure 4.10 Bagasse, a residue from processing of sugarcane Source: Warren Gretz and DOE/NREL Source: Kartha and Larson (2000, Bioenergy Primer, Modernized Biomass Energy for Sustainable Development, United Nations Development Programme, New York)
Forestry residues • Primary (left in the field): From thinning of plantations and trimming of felled trees • Secondary (produced during processing): Sawdust, bark, wood scraps from production of marketable wood; bark and black liquor from the production of pulp for paper
Processes of extracting energy from biomass • Direct combustion • Pyrolysis (heat to 300-500ºC in near absence of air) • Thermo-chemical gasification (initial pyrolysis, then heating to 800ºC under pressure) • Anaerobic digestion • Fermentation of non-woody biomass • Hydrolysis & fermentation of woody biomass • Transesterification of vegetable oils • Gasification and catalytic production of Fischer-Tropsch liquids • Gasification to produce hydrogen
Direct combustion • Cooking with firewood in developing countries, typical cook-stove efficiency is 10-20%, 30-60% with improved stoves (vs. 45-60% with gaseous fuels) • Pellet heating, central Europe in particular • District heating in Sweden, Atlantic Canada • Issues include ash content (which is related to the non-combustible silica in the biomass, which can be high) and K and Ca in the fuel, which can cause agglomeration in boilers
Figure 4.11 Traditional wood-burning stove (upper), improved wood-burning stove (middle), and charcoal-burning stove (lower) in Kenya Source: Bailis et al (2003, Environmental Science & Technology 37, 2051–2059)
Figure 4.12 A wood-burning hearth in China and its replacement with a biogas-fueled stove Source: Kartha and Larson (2000, Bioenergy Primer, Modernized Biomass Energy for Sustainable Development, United Nations Development Programme, New York)
Figure 4.13 Cookstove efficiency and cost Source: Kammen et al (2001, Policy Discussion Paper for the United Nations Development Program, Environmentally Sustainable Development Group (ESDG) and the Climate Change Clean Development Mechanism (CDM))
Figure 4.14 Biomass pellets (left) and pneumatic delivery by truck (right)
Figure 4.15 Pellet-burning stove (left) and furnace (right) Source: www.harmonstoves.com
Figure 4.16 Fuel sources for Swedish district heating Source: Swedish Energy Agency (2008, Energy in Sweden 2008, www.stem.se)
Thermo-chemical gasification • Step one: Heat biomass to a temperature of 300-500°C in the near absence of air to drive off the easily vaporized or volatile materials - a process called pyrolysis • Step two: heat the remaining residue (char) to 850-900°C in the presence of steam • Step one produces a mixture of CO, H2, CH4, and CO2 (the first 3 of which have energy value) • The gases contain about 2/3 of the energy content of the fuel, which is lost if they are not captured (as is the case in the production of charcoal). If captured, the gases can be used for heating, cooking, generation of electricity, or for cogeneration of useful heat and electricity. • Conversely, the gases can be shifted to consist almost entirely of H2, or can be used to synthesize methanol, dimethyl ether, or Fischer-Tropsch liquids (all of which are potential transportation fuels) • There were no large-scale commercial thermo-chemical gasification- of-biomass facilities anywhere as of early 2006
Figure 4.17a Proportion of original coal and cellulose remaining as solid residues as they are heated in the absence of air (pyrolysis) Source: Larson (1993, Annual Review of Energy and Environment 18, 567–630)
Figure 4.17b Rate at which the solid residues (char) from pyrolysis are converted to gas in the presence of steam Source: Larson (1993, Annual Review of Energy and Environment 18, 567–630)
Figure 4.18 Updraft fixed-bed gasifier (left) and downdraft fixed-bed gasifier (right). Source: Kartha and Larson (2000, Bioenergy Primer, Modernized Biomass Energy for Sustainable Development, United Nations Development Programme, New York)
Biological gasification (anaerobic digestion) • Occurs in sanitary landfills (in which waste including organic matter alternates with clay layers, creating anaerobic conditions and temporarily trapping any methane produced from anaerobic decomposition) • The methane is extracted with perforated pipes • The efficiency (heating value of extracted methane over heating value of the organic waste is only ~ 20%) • Can be done with greater efficiency (50-55%) in dedicated digesters
Figure 4.19 Collection of biogas from a municipal landfill Source: Ramage and Scurlock (1996, Renewable Energy, Power for a Sustainable Future, Oxford University Press, Oxford, 137-182)
Figure 4.20 Dedicated anaerobic digestion of organic solid waste with recovery of biogas, low- &high-temperature heat, and digestate as fertilizer 0.085 t of rejects for dumping Gas treatment biogas 0.040 t ferrous metals 125 m3 biogas 1 t refuse 62.5% dry matter 50% organic matter Preparation Methanization Refining digestate 0.875 t crushed material 0.156 t combustible rejects Combustion Recovery of low-temp heat kWh low-temperature heat kWh high-temperature heat Source: Ramage and Scurlock (1996, Renewable Energy, Power for a Sustainable Future, Oxford University Press, Oxford, 137-182)
Anaerobic digestion of animal and sewage wastes • 5 million household cattle-dung digesters in China, 500 large-scale digesters at pig farms and other agro-industrial sites, and 24,000 digesters at sewage treatment plants • 20 million households in China use biogas from digesters for cooking and lighting needs, and 4 million households in India • 5000 digesters in industrialized countries, primarily at livestock processing facilities and municipal sewage treatment plants
Figure 4.21 Cattle dung digester in India Source: Kartha and Larson (2000, Bioenergy Primer, Modernized Biomass Energy for Sustainable Development, United Nations Development Programme, New York)
Figure 4.22 Digester on a pig farm in England Source: Unknown
Figure 4.23a Indian digester design Source: Kartha and Larson (2000, Bioenergy Primer, Modernized Biomass Energy for Sustainable Development, United Nations Development Programme, New York)