Download
1 / 37
370 likes | 396 Vues
Explore the phases of the cell cycle, dynamics of DNA binding, and regulatory molecules governing cell fate. Dive into the intricate molecular events and key discoveries that shape cell division processes. Discover the role of cyclins and cyclin-dependent kinases in cell cycle progression.

E N D
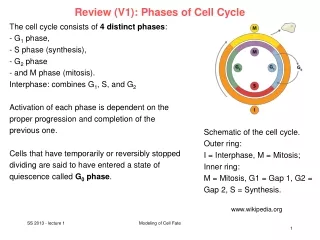
Review (V1): Phases of Cell Cycle • The cell cycle consists of 4 distinct phases: • - G1 phase, • - S phase (synthesis), • G2 phase • and M phase (mitosis). • Interphase: combines G1, S, and G2 • Activation of each phase is dependent on the proper progression and completion of the previous one. • Cells that have temporarily or reversibly stopped dividing are said to have entered a state of quiescence called G0 phase. Schematic of the cell cycle. Outer ring: I = Interphase, M = Mitosis; Inner ring: M = Mitosis, G1 = Gap 1, G2 = Gap 2, S = Synthesis. www.wikipedia.org Modeling of Cell Fate
Review (V2): DNA-binding and dissociation dynamics DNA-binding and dissociation dynamics of the oriC DnaA complex (red) and of RNA (blue) and DNA (green) polymerases for one in silico cell. The oriC DnaA complex recruits DNA polymerase to the oriC to initiate replication, which in turn dissolves the oriC DnaA complex. RNA polymerase traces (blue line segments) indicate individual transcription events. The height, length, and slope of each trace represent the transcript length, transcription duration, and transcript elongation rate, respectively. Inset : several predicted collisions between DNA and RNA polymerases that lead to the displacement of RNA polymerases and incomplete transcripts. Modeling of Cell Fate
Review (V1): Regulation of the eukaryotic cell cycle Regulation of the cell cycle involves processes crucial to the survival of a cell, including the detection and repair of genetic damage as well as the prevention of uncontrolled cell division. The molecular events that control the cell cycle are ordered and directional. Each process occurs in a sequential fashion. It is impossible to "reverse" the cycle. Leland Hartwell Tim Hunt Paul Nurse Noble Price in Physiology/Medicine 2001 „for their discoveries of key regulators of the cell cycle“ Two key classes of regulatory molecules, cyclins and cyclin-dependent kinases (CDKs), determine a cell's progress through the cell cycle. www.wikipedia.org Modeling of Cell Fate
Review (V1): Cell cycle control model Tyson et al, Curr. Op. Cell Biol.15 (2003) 221 Modeling of Cell Fate 4
Early embryonic cell cycles of frogs In the early embryonic cell cycles, where cyclin was first discovered, there are 3 cyclins and 2 Cdks. Cyclins A and B rise during interphase and fall during mitosis, whereas the cyclin E remains constant. Cdk1 binds cyclins A and B and Cdk2 binds cyclins A and E. The cyclin/Cdk complexes induce two processes, duplication of centrosomes and DNA during interphase, and mitosis. The roles of individual cyclins were tested by adding recombinant proteins to cyclin-depleted extracts. Cyclin E supports DNA replication and centrosome duplication, cyclin A supports both of these processes and mitosis, and cyclin B supports mitosis alone. Murray AW, Cell 116, 221-234 (2004) Modeling of Cell Fate
Review (V1): Cdk1-phosphorylation sites Cdk1 substrates frequently contain multiple phosphorylation sites that are clustered in regions of intrinsic disorder. Their exact position in the protein is often poorly conserved in evolution, indicating that precise positioning of phosphorylation is not required for regulation of the substrate. Cdk1 interacts with nine different cyclins throughout the cell cycle. Expression of human cyclins through the cell cycle. www.wikipedia.org Enserink and Kolodner Cell Division 2010 5:11 Modeling of Cell Fate www.wikipedia.org
Accidental discovery of cyclins It is difficult to believe that the behavior of the cyclins is not connected with processes involved in cell division, but at this stage we have no direct evidence that it is. … Unfortunately, we have no direct evidence as to the physiological role of cyclin, but one of its more plausible roles is promoting either directly or indirectly the breakdown of the nuclear envelope … Modeling of Cell Fate
Simplest model for cell cycle Cyclin’s discovery led to a model of the autonomous oscillator that drove the cell cycle of early embryonic cells. Murray AW, Cell 116, 221-234 (2004) Modeling of Cell Fate
Who regulates the cell cycle? The discovery of cyclin was one of 3 strands of work that came together to produce the first working model of the cell cycle oscillator. Nurse et al. identified a network of genes that controlled entry into mitosis. Its key component is the protein kinase Cdk1. Masui and Smith identified maturation-promoting factor (MPF), a biochemical activity that induces meiosis and mitosis. Lohka purified MPF. Its two subunits turned out to be Cdk1 and cyclin B. Later work showed that different cyclin-Cdk complexes are activated at different points in the cell cycle, that cyclins must be destroyed before cells can escape from mitosis, and that mitotic cyclins were destroyed by ubiquitin-mediated proteolysis Murray AW, Cell 116, 221-234 (2004) Modeling of Cell Fate
How do cyclins die? The obvious questions for cyclin were how is it degraded, by whom, and how is its degradation regulated? All known cyclins are targeted to the proteasome by the addition of a chain of ubiquitins. G1 cyclins are ubiquitinated by the SCF complex, whereas mitotic cyclins are ubiquitinated by the anaphase-promoting complex (APC). Murray AW, Cell 116, 221-234 (2004) Modeling of Cell Fate
1-gene model for cell oscillator ; Boolean network Boolean Network produces oscillatory behavior Cdk1 off Cdk1 on Cdk1 off Cdk1 on ... Modeling of Cell Fate
Aim: simplest ODE model Here, we assume that CDK1 is activated by the rapid, high-affinity binding of cyclin, which is being synthesized at a constant rate 1 (blue). For CDK1 inactivation, we will assume mass action kinetics (pink). This model contains two time-dependent variables, CDK1* and APC*. Modeling of Cell Fate
1-gene model ; ODE model To allow the system to be described by an ODE with a single time-dependent variable, we assume that the activity of APC is regulated rapidly enough by CDK1* so that it can be considered an instantaneous function of CDK1*. What functional form should we use for APC’s response function? Here, we will assume that APC’s response to CDK1* is ultrasensitive — sigmoidal in shape, like the response of a cooperative enzyme — and that the response is described by a Hill function. Modeling of Cell Fate
##################### ### Create a plot ### ##################### import pylab ### plot x,y pylab.plot(timecourse, result) ### lower and upper bound y axxis pylab.ylim([0.0,1.0]) ax = pylab.gca() ax.set_xlabel("Time") ax.set_ylabel("CDK1") pylab.savefig('CDK1.png') pylab.show() #!/usr/bin/python ############################### ### Modeling Cell Fate ### ### Simple Single-ODE Model ### ############################### from scipy.integrate import odeint from numpy import linspace ### set parameters a, b, K, n = 0.1, 1.0, 0.5, 8.0 ### ODE Function def dCDK1(CDK1, t): return a - b * CDK1 * CDK1**n / (K**n + CDK1) # use a window from 0 to 25 with 100 intermediate steps timecourse = linspace(0, 25, 100) # Starting concentration of CDK CDK1 = 0 # Solve ODE giving the ODE function, # @parameters ODE function, (list of) starting value(s), timeframe # @return numpy.array result = odeint(dCDK1, CDK1, timecourse) # continue script with code shown on the right Modeling of Cell Fate No oscillation!
2-gene model ; Boolean network 2-gene model Boolean Network produces oscillatory behavior Assignment 1: implement corresponding ODE model. Modeling of Cell Fate
3-gene model ; Boolean network Boolean Network produces oscillatory behavior but does not visit all possible states (dashed lines). Modeling of Cell Fate
Is the cyclin-CDK oscillator essential? The cyclin–CDK oscillator governs the major events of the cell cycle. In embryonic systems this oscillator functions in the absence of transcription, relying only on maternal stockpiles of messenger RNAs and proteins. CDKs are also thought to act as the central oscillator in somatic cells and yeast. Orlando et al., Nature 453, 944-947 (2008) Modeling of Cell Fate
What happens in cyclin-mutant cells? However, by correlating genome-wide transcription data with global TF binding data, models have been constructed in which periodic transcription is an emergent property of a TF network. In these networks, TFs expressed in one cell-cycle phase bind to the promoters of genes encoding TFs that function in a subsequent phase. Thus, the temporal program of transcription could be controlled by sequential waves of TF expression, even in the absence of extrinsic control by cyclin–CDK complexes Orlando et al., Nature 453, 944-947 (2008) Modeling of Cell Fate
What happens in cyclin-mutant cells? -> investigate the dynamics of genome-wide transcription in budding yeast cells that are disrupted for all S-phase and mitotic cyclins (clb1,2,3,4,5,6). These cyclin-mutant cells are unable to replicate DNA, to separate spindle pole bodies, to undergo isotropic bud growth or to complete nuclear division. -> indicates that mutant cells are devoid of functional Clb–CDK complexes. So, by conventional cell-cycle measures, clb1,2,3,4,5,6 cells arrest at the G1/S border. Expectation: if Clb–CDK activities are essential for triggering the transcriptional program, then periodic expression of S-phase-specific and G2/M-specific genes should not be observed. Orlando et al., Nature 453, 944-947 (2008) Modeling of Cell Fate
Periodic transcripts in wt and cyclin-mutant cells Aim: Identify periodically expressed genes. For each gene, i, a Fourier score, Fi , was computed as where ω = 2π/T and T is the interdivision time. Similarly, scores were calculated for 1 000 000 artificial profiles constructed by random shuffling of the data points within the expression profile of the gene in question. The P-value for periodicity was calculated as the fraction of artificial profiles with Fourier scores equal to or larger than that observed for the real expression profile. Heat maps depicting mRNA levels of 1271 periodic genes for wild-type cells. Each row represents data for one gene. Orlando et al., Nature 453, 944-947 (2008) Modeling of Cell Fate
Periodic transcripts in wt and cyclin-mutant cells mRNA levels of periodic genes for wild-type (a) and cyclin-mutant (b) cells. Each row in a and b represents data for the same gene. The S and G2/M phases of the cyclin-mutant timeline are shaded. By conventional definitions, cyclin-mutant cells arrest at the G1/S-phase border. • Observations • Expression of 883 genes is altered in the mutant (so that they are likely regulated by B-cyclin CDK, • However, although mutant cells are arrested at G1/S border, gene regulation program seems to continue … Orlando et al., Nature 453, 944-947 (2008) Modeling of Cell Fate
Transcriptional dynamics of cyclin-CDK regulated genes (a) Gene CLN2 (that is regulated by late G1-transcript SBF) is not fully repressed in mutant. ok (b) Gene RNR1 (that is regulated by MBF) is not affected. Genes SIC1 (c) and NIS1 (d) are regulated by Ace2/Swi5. These TFs are usually excluded from the nucleus by CDK phosphorylation until late meiosis.In cyclin-mutant cells, nuclear exclusion of Swi5 and Ace2 is probably lost -> Early onset observed in the mutant. The Clb2-cluster genes CDC20 (e) and ACE2 (f) are strongly down-regulated. Solid lines, wild-type cells; dashed lines, cyclin-mutant cells. Orlando et al., Nature 453, 944-947 (2008) Modeling of Cell Fate
Clustering of genes Cluster genes showing altered behaviors in cyclin-mutant cells. a, Clusters of genes with similar expression patterns in wild-type cells. b, Subclusters of genes with similarly altered expression patterns in cyclin-mutant cells. Associate each cluster with up to 5 over-represented TFs (hypergeometric test). Orlando et al., Nature 453, 944-947 (2008) Modeling of Cell Fate
Review (SWW) Hypergeometric Test The hypergeometrical test is a statistical test that checks whether a biological annotation π is significantly enriched in a given test set of genes relative to the full genome. ▪ N : number of genes in the genome. ▪ n : number of genes in the test set. ▪ Kπ : number of genes in genome with annotation π. ▪ kπ : number of genes in the test set with annotation π. The hypergeometric p-value denotes the probability that kπ or more randomly selected gene from the genome also have annotation π. p-Wert = http://great.stanford.edu/
Review (SWW) Hypergeometric Test Select i = kπ genes with annotation π from the genome. There are exaclty Kπ suc genes. The remaining n – i genes in the test set do not have annotation π. There are exactly N - Kπ.such genes in the genome. p-Wert = Denominator accounts for the combinatoric number of possibilities for selecting n elements from a set with N elements. In this case, the sequence of elements does not matter. The summation runs from kπ elements to the maximal possible number of elements. One upper limit is set by the number of genes with annotation π in the genome (Kπ). The other upper limit is set by the number of genes in the test set (n). http://great.stanford.edu/ http://www.schule-bw.de/
Review (SWW) example p-Wert = Question: is annotation π significantly enriched in the test set of 3 genes? Yes! p = 0.05 is significant. http://great.stanford.edu/
Independent transcriptional program The periodic transcription program is largely intact in cyclin mutant cells that arrest at the G1/S border. a, b, Genes maintaining periodic expression in cyclin-mutant cells (a) show similar dynamics in wildtype cells (b). On the other hand, nearly 70% of the genes identified as periodic in wild-type cells are still expressed on schedule in cyclin-mutant cells. This demonstrates the existence of a cyclin–CDK-independent mechanism that regulates temporal transcription dynamics during the cell cycle. Orlando et al., Nature 453, 944-947 (2008) Modeling of Cell Fate
Generate TF networks for wt and cyclin-mutant cells Transcriptional activators are depicted in green, repressors in red, and the cyclin Cln3 in blue. Periodically expressed TFs are placed on the cell-cycle timeline on the basis of the time of peak transcript levels. Arrows indicate a documented interaction between a TF and promoter elements upstream of a gene encoding another TF. Orlando et al., Nature 453, 944-947 (2008) Modeling of Cell Fate
Orlando et al., Nature 453, 944-947 (2008) Modeling of Cell Fate
Orlando et al., Nature 453, 944-947 (2008) Modeling of Cell Fate
Boolean model A synchronously updating Boolean model can reproduce the sequential order of TF expression. a, The actual expression of the variables in Fig. 4c compared to the on/off (yellow/cyan) states of those variables in b, Cycle 1, c, Cycle 2, and d, Cycle 3. Orlando et al., Nature 453, 944-947 (2008) Modeling of Cell Fate
Sschematic of the computational analysis pipeline. Colors correspond to different analysis topics (e.g., yellow represents identification of periodic genes). Shapes correspond to particular types of procedures or data (e.g., diamonds are filters and cylinders are external data). White numbers within a shape indicate the size of the corresponding gene set (e.g., the 882 in Item 15 indicates that 882 genes maintain their periodic expression in cyclin-mutant cells) Orlando et al., Nature 453, 944-947 (2008) Modeling of Cell Fate
Logic of Boolean network Orlando et al., Nature 453, 944-947 (2008) Modeling of Cell Fate
Model parameters fitted to exp. data CLOCCS model fits: synchronizes exp. data from different measurements 100 random realizations from the Markov chain used to fit each experiment were used as parameterizations for the model, and the resulting predicted budding curves for one bud (green lines) and two or more buds (red lines) are shown. Orlando et al., Nature 453, 944-947 (2008) Modeling of Cell Fate
Boolean network model c, Synchronously updating boolean network model. TFs are arranged on the basis of the time of peak transcript levels in cyclin-mutant cells. Arrows indicate TF/promoter interaction. Activating interactions, outer rings; repressive interactions, inner rings. Colouring indicates activity in one of five successive states; SBF and YHP1 are active in two states. Orlando et al., Nature 453, 944-947 (2008) Modeling of Cell Fate
Boolean attractors 80.3% of all the 512 possible starting states enter a cycle containing five states (Cycle 1). Cycle 2 and Cycle are qualitatively similar to Cycle . They maintain the same temporal order of expression as Cycle 1, and differ only in the duration of expression of certain TFs Orlando et al., Nature 453, 944-947 (2008) Modeling of Cell Fate
Summary The cyclin–CDK oscillator governs the major events of the cell cycle. Simple Boolean networks or ODE-models can generate oscillatory behavior. (see assignment 1) However, there exists an independent TF network in yeast (in all higher eukaryotes?) that drives periodic expression of many genes throughout cell cycle. Modeling of Cell Fate