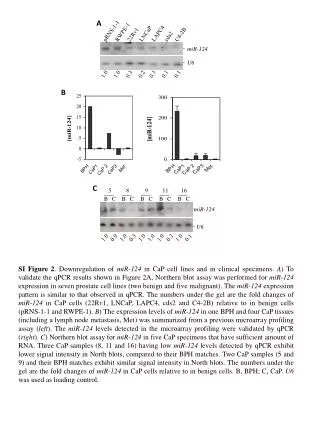
MIR OZONE
MIR OZONE. ISSUES Horizontal (STE) and vertical transport (long life time in UTLS) Photochemical production by precursors (biomass burning, lightning,..) ? Origin of wave number one distribution in tropospheric column ?. Ozone. Hurricane. 2001 54 profiles. 2003 11 profiles.

MIR OZONE
E N D
Presentation Transcript
MIR OZONE ISSUES Horizontal (STE) and vertical transport (long life time in UTLS) Photochemical production by precursors (biomass burning, lightning,..) ? Origin of wave number one distribution in tropospheric column ?
Ozone Hurricane 2001 54 profiles 2003 11 profiles
SAOZ-MIR 2004 A little less in LS and UT than in 2001-2003 (lower lat, QBO, later season) Very small variability in LS, larger in UT and TTL, similar to 2001-2003
Ozone partial column 7-32 km Most of Wave number one in TTO due to UT and TTL and not to Lower troposphere (biomass burning)
Ozone at 20°S MIR SAOZ March 2001 % deviation from zonal mean Walker Circulation (Newel 1979) Minima in TTL over convective areas, particularly maritime (O3 destruction at surface level over Ocean), Maxima over subsident regions (meridional horizontal transport) Ozone distribution mainly controlled by transport (quasi-horizontalfrom mid-latitude and vertical by convection
March 2004 Very similar ideas: Max in UT over subsident oceanic areas Minimum over convection, lowest over maritime convection
Ozone partial column 7-32 km Most of Wave number one in TTO due to UT and TTL and not to Lower troposphere (biomass burning)
Ozone variability along latitude circle in 2001 • ± 3% above 20 km • ± 15% in TTL above TT • ± 35% in UT • Removal of • H. Transport (PV correlation) • Vert. Transport (340-370 K thickness) • Predominantly H. transport • Contrib. of convection up to 19km • Others in UT and TTL (chemistry, errors) <7% Top TTL Tropopause Difference between maritime and continental convection ?
MIR-SAOZ Water vapour Measurements : 3 Wavelength ranges: 590 nm, 760 nm and 940 nm GOAL Which process is controlling the dehydration of stratospheric air ? Convective dehydration (air already dehydrated in convective clouds) ? Or Cold-trap dehydration (dehydration within slow ascending air in coldest TTL through fast horizontal transport) ?
Cold Point Tropopause SAOZ- MIR H2O compared to SDLA, HALOE and ECMWF
SDLA2, SDLA4, ECMWF, MIR, HALOE, GOMOS 25 20 Altitude (km) 15 10 GOMOS 5 1 10 102 103 104 Water Vapour MR ppm
Water Vapour Zonal distribution E. Pacific Atlantic Indian Cold Point Minima at cold point level over subsident maritime areas (STE ?) Maxima over deepest convective areas : Africa, S. America and SPCZ
Temperature derived from O2 density (preliminary, 5K bias) Cold Point Maximum H2O at coldest cold point level over convective areas !
MIR-SAOZ 2004 Extinction < 1e-2 km-1 = thin cirrus
Atmospheric Extinction SPCZ S. America Africa Hurricane Cold Point Tropopause Opaque clouds barely at lapse rate tropopause Thin cirrus predominantly over convective areas
DJF average Water vapour (ppm) at 100 hPa. Left HALOE, right MOZART 3.8 3 3 3 3.6 3.4 3.8 Max over convective areas : Africa, S. America and SPCZ Min over subsident oceanic areas
MLS 100 hPa East QBO West QBO Black contour: UKMO temp <193.5 White: OLR <220W/m2
MLS 83 hPa
ECMWF / REPROBUS Feb-Mar 04 Read et al. 2004 UARS MLS 100 hPa 83 hPa
Preliminary conclusions Water vapour maxima at cold point level over deepest convective areas, coldest cold point temp and max cirrus. Minimum over subsident maritime areas (STE ?) Fully consistent with HALOE seasonal average and MLS 1992/93 (same QBO phase) Lesser agreement with ECMWF New GOMOS H2O available (still preliminary) Further work Improved comparisons with other Hibiscus observations Correlation with H and V transport indices Comparisons to global scale simulations