Investigation of miRNA Expression and Methylation Patterns in C20 Normal Liver Samples
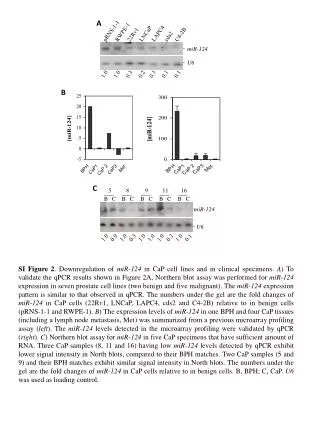
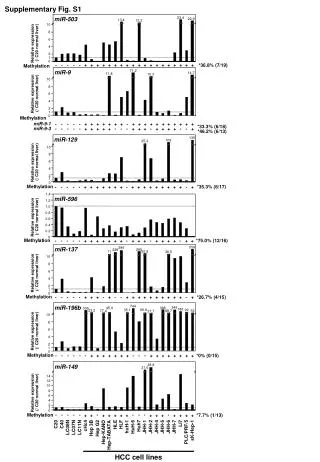
This study analyzes the relative expression and methylation patterns of various microRNAs (miRNAs) in normal liver tissues using the C20 reference sample. Notable findings include the relative expression percentages of miR-503 (36.8%), miR-9-1 (33.3%), and miR-9-3 (46.2%), among others. Methylation levels also varied significantly, providing insight into the regulatory mechanisms of liver function and potential implications in liver disease. Results were derived from multiple liver cell lines, contributing to the broader understanding of miRNA involvement in liver biology and pathology.

Investigation of miRNA Expression and Methylation Patterns in C20 Normal Liver Samples
E N D
Presentation Transcript
Supplementary Fig. S1 23.4 miR-503 22.9 13.4 12.2 10 8 6 Relative expression (/ C20 normal liver) 4 2 1 0 - - - - - + + + + + + + + + + + + + + + + + + + *36.8% (7/19) Methylation 71.2 miR-9 14.7 11.8 10.3 10 8 Relative expression (/ C20 normal liver) 6 4 2 1 0 Methylation - - - - - + + + + + + + - + + + + + + + + + + + miR-9-1 *33.3% (6/18) - - - - - + + + + + - - - + + + - + + + + - - + miR-9-3 *46.2% (6/13) 135 miR-129 109 25.2 10 8 Relative expression (/ C20 normal liver) 6 4 2 1 0 *35.3% (6/17) - - - - - + + + + + + + - + + + + + + + + + - + Methylation 1.4 miR-596 1.2 1.0 0.8 Relative expression (/ C20 normal liver) 0.6 0.4 0.2 0 *75.0% (12/16) + - - - - - + + + + + + + - + + + - + + + + - + Methylation 556 394 miR-137 285 229 55.8 11 38.5 10 8 Relative expression (/ C20 normal liver) 6 4 2 1 0 - - - - - + + + - + - - + + + + + + + + + + - + *26.7% (4/15) Methylation miR-196b 744 343 388 45.9 336 186 56.9 35.1 92 23.2 52 88.7 77.4 27.7 10 8 Relative expression (/ C20 normal liver) 6 4 2 1 0 - - - - - - + + + + + + + - - - + + + + + + + + *0% (0/15) Methylation 38.8 miR-149 21.6 14 12 10 Relative expression (/ C20 normal liver) 8 6 4 2 1 0 - - - - - - - - - - *7.7% (1/13) + + + + + + + + + + + + + + Methylation Li7 C20 C40 HLF HLE cHc4 Huh7 huH-1 JHH-1 JHH-2 JHH-4 JHH-5 JHH-6 JHH-7 HuH-6 LC08N LC07N LC11N Hep 3B Hep G2 sK-Hep-1 PLC/PRF/5 Hep-KANO Hep-TABATA HCC cell lines