Download
1 / 40
400 likes | 447 Vues
Learn about ECG basics, measurement techniques, typical wave intervals, and signal generation in biomedical engineering. The ECG is a vital tool for diagnosing various heart conditions.

E N D
Introduction to ECG EEE 491 Biomedical Engineering Compiled by Dr. Khawza I Ahmed
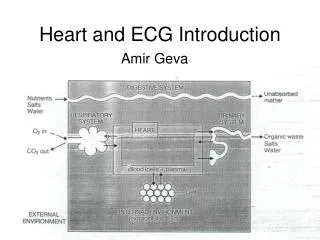
What is ECG? • The electrocardiogram (ECG) is a time-varying signal reflecting the ionic current flow which causes the cardiac fibers to contract and subsequently relax. The surface ECG is obtained by recording the potential difference between two electrodes placed on the surface of the skin. A single normal cycle of the ECG represents the successive atrialdepolarisation/repolarisation and ventricular depolarisation/repolarisation which occurs with every heart beat. • Simply put, the ECG (EKG) is a device that measures and records the electrical activity of the heart from electrodes placed on the skin in specific locations
What the ECG is used for? • Screening test for coronary artery disease, cardiomyopathies, left ventricular hypertrophy • Preoperatively to rule out coronary artery disease • Can provide information in the precence of metabolic alterations such has hyper/hypo calcemia/kalemia etc. • With known heart disease, monitor progression of the disease • Discovery of heart disease; infarction, coronal insufficiency as well as myocardial, valvular and cognitial heart disease • Evaluation of ryhthm disorders • All in all, it is the basic cardiologic test and is widely applied in patients with suspected or known heart disease
Measuring ECG • ECG commonly measured via 12 specifically placed leads
The 12-Leads The 12-leads include: • 3 Limb leads (I, II, III) • 3 Augmented leads (aVR, aVL, aVF) • 6 Precordial leads (V1- V6) For more presentations www.medicalppt.blogspot.com
Typical ECG • A typical ECG period consists of P,Q,R,S,T and U waves
ECG Intervals / Segments PR: 0.12-0.20 sec QRS: <0.10 sec QT: 0.30-0.40 sec (60 bpm)
ECG Waves • P wave: the sequential activation (depolarization) of the right and left atria • QRS comples: right and left ventricular depolarization • T wave: ventricular repolarization • U wave: origin not clear, probably ”afterdepolarizations” in the ventrices
Electrocardiogram (ECG/EKG) • Is a recording of electrical activity of heart conducted thru ions in body to surface 13-60
Cardiac Cellular Electrical Activity Typical Equilibrium Potentials: Na(+) ~+40mV K(+) ~-90mV C(++) ~+150mV
ECG • 3 distinct waves are produced during cardiac cycle • P wave caused by atrial depolarization • QRS complex caused by ventricular depolarization • T wave results from ventricular repolarization Fig 13.24 13-63
Elements of the ECG: • P wave: Depolarization of both atria; • Relationship between P and QRS helps distinguish various cardiac arrhythmias • Shape and duration of P may indicate atrial enlargement • PR interval: from onset of P wave to onset of QRS • Normal duration = 0.12-2.0 sec (120-200 ms) (3-4 horizontal boxes) • Represents atria to ventricular conduction time (through His bundle) • Prolonged PR interval may indicate a 1st degree heart block • QRS complex: Ventricular depolarization • Larger than P wave because of greater muscle mass of ventricles • Normal duration = 0.08-0.12 seconds • Its duration, amplitude, and morphology are useful in diagnosing cardiac arrhythmias, ventricular hypertrophy, MI, electrolyte derangement, etc. • Q wave greater than 1/3 the height of the R wave, greater than 0.04 sec are abnormal and may represent MI
ST segment: • Connects the QRS complex and T wave • Duration of 0.08-0.12 sec (80-120 msec • T wave: • Represents repolarization or recovery of ventricles • Interval from beginning of QRS to apex of T is referred to as the absolute refractory period • QT Interval • Measured from beginning of QRS to the end of the T wave • Normal QT is usually about 0.40 sec • QT interval varies based on heart rate
Elements of the ECG: • P wave • Depolarization of both atria; • Relationship between P and QRS helps distinguish various cardiac arrhythmias • Shape and duration of P may indicate atrial enlargement
QRS complex: • Represents ventricular depolarization • Larger than P wave because of greater muscle mass of ventricles • Normal duration = 0.08-0.12 seconds • Its duration, amplitude, and morphology are useful in diagnosing cardiac arrhythmias, ventricular hypertrophy, MI, electrolyte derangement, etc. • Q wave greater than 1/3 the height of the R wave, greater than 0.04 sec are abnormal and may represent MI
PR interval: • From onset of P wave to onset of QRS • Normal duration = 0.12-2.0 sec (120-200 ms) (3-4 horizontal boxes) • Represents atria to ventricular conduction time (through His bundle) • Prolonged PR interval may indicate a 1st degree heart block
T wave: • Represents repolarization or recovery of ventricles • Interval from beginning of QRS to apex of T is referred to as the absolute refractory period
ST segment: • Connects the QRS complex and T wave • Duration of 0.08-0.12 sec (80-120 msec • QT Interval • Measured from beginning of QRS to the end of the T wave • Normal QT is usually about 0.40 sec • QT interval varies based on heart rate