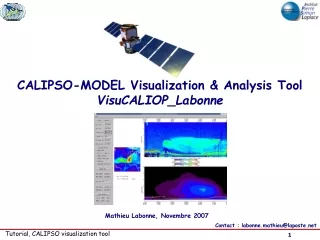
CALIPSO-MODEL Visualization & Analysis Tool VisuCALIOP_Labonne
200 likes | 230 Vues
A tool written in IDL language for visualizing and analyzing CALIPSO and PARASOL data, enabling pre-processing and model data display. Access CALIOP and PARASOL data through ICARE to utilize this tool effectively.

CALIPSO-MODEL Visualization & Analysis Tool VisuCALIOP_Labonne
E N D
Presentation Transcript
CALIPSO-MODEL Visualization & Analysis Tool VisuCALIOP_Labonne Mathieu Labonne, Novembre 2007 Contact : labonne.mathieu@laposte.net
1. data and pre-processing in iCARE 2. steps to use the tool 3. tool functionalities basic description
1. data Data displayed The tool uses 3 different data : - Pre-processed data files created in ICARE and copied to your machine (explained in slide 5). - some model outputs for comparison (explained in slide 8) - some active fire data to determine fire locations Active fire data are read in the “path_fire” directory using the get_fires function. The current version of the code uses MODIS fire products that are not under public access. To access these MODIS fire products please read : ftp://mapsftp.geog.umd.edu/welcome.txt
1. data Pre-processing in ICARE CALIPSO level-1 data are very heavy and a selection of a sub set of parameters is sufficient for this visualization tool. In addition the level-1 data horizontally interpolated from 300m to 3km. A pre-processing is applied to reduce the size and prepare the files with CALIOP data for the tool on the ICARE ressource center in Lille. You need authorization to get access to CALIOP and PARASOL data, contact ICARE: contact@icare.univ-lille1.fr The IDL function called create_CALIPSO_tabs pre-processes: - CALIOP level 1 data in /DATA/LIENS/CALIOP - CALIOP level 2 data in /DATA/LIENS/CALIOP - Winds from ECMWF in /DATA/LIENS/PARASOL/ANCILLAIRE/METEO/ - ECMWF PBL height (maximum during the 24h before) It also produces an array of all the latitudes and longitudes of the day. The name of the file is YYYY_MM_DD_liste_longilatit where YYYY is the year, MM the month and DD the day.This array enables the visualisation tool to shift quickly to another track in the selected frame. (If this array is missing, the “create_longi_latit” function within the visualization tool is called and it takes between one and two minutes to be executed.)
CALIOP on CALIPSO 1. data • ascending orbit, 29/30 half-orbits/day • Orbit cycle : 16 days => 233 orbits in a cycle • always comes from the East (inclination = 98,2°) • night orbits: upper right to lower left on the plots • day orbits lower right to upper left on the plots • Day is defined for a sun-earth-satellite angle between -95° to 95°. So “CALIPSO day” is longer than “CALIPSO night” (about 52 min for day and 46 min for night) • vertical resolution: 300m in raw data (in hdf files in ICARE), smoothed to 3km for this tool • horizontal resolution: 20m • To know more about CALIPSO please refer to http://smsc.cnes.fr/CALIPSO/ or http://www-calipso.larc.nasa.gov
1. data Preprocessing in ICAREthe IDL routine create_CALIPSO_tabs Select the files to consider regarding the selected frame Enter the loop over the files to consider Collect CALIPSO data Collect ECMWF BLH Collect Winds using read_meteo function Save the track data in the pre-processed file
1. data Model data The model data need to be written in netcdf format. The filename must finish by '.mXX.dYY.nc' where XX is the month number and YY is the day number ('.m01.d02.nc' for example if the date is the 2nd of January). The file must include the following variables : -X : longitude of the grid -Y : latitude of the grid -pmid3d : pressure at the middle of the boxes in Pa [x,y,z] -DH3D : vertical box heigth in km [x,y,z] -OD5503DD_BC : BC AOD per layer 550nm [x,y,z] -OD5503DD_FINE : Fine Mode AOD per layer 550nm [x,y,z] -OD5503DD_POM : POM AOD per layer 550nm [x,y,z] -OD5503DD_SS : Sea Salt AOD per layer 550nm [x,y,z] -OD5503DD_SO4 : SO4 AOD per layer 550nm [x,y,z] -OD5503DD_DUST : Dust AOD per layer 550nm [x,y,z] -OD5503DD_AER : Total AOD per layer 550nm [x,y,z] All AOD are basically given here at 550nm but the user can use other wavelength close to 532nm or 1064nm (CALIPSO channels). Nevertheless, the user must keep the same names for the variables.
2. steps to use Launch the visualization tool on your local machine Get the IDL routines: cp /home/aerocom1/CALIOP/visuCALIOP_Labonne.pro <your_directory> The whole tool is in one file including more than 20 functions. Launch idl Compile the function for the visualization tool:>.compile visuCALIOP_Labonne.pro Plot the day of you choice: >visuCALIOP_Labonne, year= , month= , day= After, you can navigate interactively
2. steps to use EXAMPLE: you want to visualize the 1st of March 2007. Connect in ICARE: ssh username@icarbure.icare.univ-lile1.fr cd /home/labonne >idl >.compile create_tabs_CALIPSO.pro >create_tabs_CALIPSO, day=1, month=3, year=2007 It will create about 29 (=number of orbits/day )files in “path_outputs” named 2007_03_01_* (it takes ~10min) + 2007_03_01_liste_longilatit. Create a directory called 2007_03_01 Copy all the files in this directory, including 2007_03_01_liste_longilatit ( « mv 2007_03_01_* 2007_03_01 ») Copy (“scp -r”) this directory from ICARE in the “path_caliop” directory Compile: >compile visuCALIOP_Labonne.pro after checking the directory paths Launch: >visuCALIOP_Labonne, day=1, month=3, year=2007 On Icare Local
3. tool functionalities Main algorithm basic description visuCALIOP_Labonne get_paths Set directory paths for the different inputs Create the visualization window with the buttons create_visu_window Find the track numbers to consider. find_tracks Realize the plots regarding the track that is considered. Slide 12 go_to_track param_event profiles_event A click on the cross section generates a new window showing the CALIPSO and model cross section profiles at the selected location actions depending on events on the left side of the window. Slide 13-20
3. tool functionalities go_to_track If it needs to change the current selected track it is said by a keyword. Then it reads the corresponding data Change the file and the data Computes attenuated backscatter profiles along CALIPSO subtrack from the model extinction pick_up_model_outputs plot_model_outputs Plots the model attenutaed backscatter on window lower half. Plots the measured attenuate backscatter on window upper half plot_calipso Plots a map showing CALIPSO subtrack. The colored font gives the Model Total AOD if the model profile is plotted. plot_map
3. tool functionalities param_event Level-2 CALIPSO products can be used to show the aerosol and cloud layers detected by the standard CALIPSO algorithm. plot_calipso
3. tool functionalities param_event Select altitude range for CALIPSO and model display plot_model_outputs plot_calipso plot_map
3. tool functionalities param_event Minimum values: Hor: 3km Vert: 20m Change the horizontal or vertical « smoothing » plot_calipso
3. tool functionalities param_event Many options to change CALIPSO and model display using flags in the code plot_model_outputs plot_calipso plot_map
3. tool functionalities param_event Create a window to choose coordinates When the user defines the box, enter select_coord find_tracks : to know the new list of CALIPSO tracks inside the box go_to_track : shift to the track that crosses the new box and then plot the profiles and the map
3. tool functionalities param_event A shift to the following or previous track in the list of the tracks crossing the selected frame. go_to_track
3. tool functionalities param_event Change the current day to consider change_day : change the data and the list of tracks to consider (find_tracks) go_to_track : shift to the first track of the new current day and plot the profiles and the map
3. tool functionalities param_event The model display may use either the total extinction, either the extinction for various aerosol types (dust, sulfate, black carbon...) plot_model_outputs plot_calipso plot_map