Presented at the Second Suomi NPP Applications Workshop
200 likes | 229 Vues
Flood Detection with S-NPP and JPSS In the context of the CEOS Disaster Risk Management Flood Pilot the GEO Regional End-to-End Disaster Systems Task and the NOAA JPSS Proving Ground Flood Project. Presented at the Second Suomi NPP Applications Workshop

Presented at the Second Suomi NPP Applications Workshop
E N D
Presentation Transcript
Flood Detection with S-NPP and JPSSIn the context of the CEOS Disaster Risk Management Flood Pilotthe GEO Regional End-to-End Disaster Systems Task and the NOAA JPSS Proving Ground Flood Project Presented at the Second Suomi NPP Applications Workshop Hosted by the University of Alabama at the Westin Huntsville Stu Frye NASA/GSFC/SGT (stuart.frye@nasa.gov) Mitch Goldberg NOAA/JPSS (mitch.goldberg@noaa.gov) 19 November 2014 Thanks to Pat Cappelaere (Vightel Inc.) and Sanmei Li (George Mason University) for their assistance in preparing this presentation
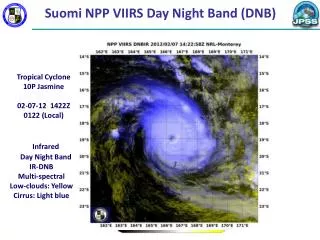
Agenda MODIS Composite for 2014 flooding in Bihar India • Context/Overview • Why create flood maps • Modeling (forecasts) versus monitoring (nowcasts) • Flood monitoring from satellites • Flood event overview (daily, global, low-moderate resolution, can capture entire event and detect flood maximum extent) • Flood detail maps (periodic, targeted, high resolution, cover much smaller areas of interest over widely spaced moments in time • International setting for implementation of satellites maps • NOAA NWS Flood Applications 2
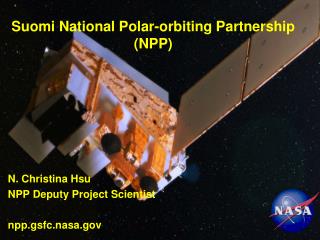
Context/Overview • Purpose – to improve delivery of satellite data and products for societal benefit in local/regional settings, but on a global scale • Method - develop and infuse Earth Observation (EO) science applications for monitoring and modeling combined with advanced technology for data acquisition, processing, and product distribution for disaster applications • Sensor Webs technology compatible with Global Earth Observation System of Systems architecture • Experience – NASA/NOAA collaboration built into Committee on Earth Observation Satellites (CEOS) and Group on Earth Observations (GEO) activities • CEOS Actions and GEO Tasks address ground validation, crowd sourcing, and hand-held clients to validate disaster products and services • Capacity building to infuse standardized web servers and clients that provide open access to critical disaster management information, data, and maps via the internet using common, open desktop tools • Status - task objectives, PI’s for each product, end user identification, team members, and accomplishments to date are contained herein • Upcoming venues for showcasing USA satellite disaster applications – UNISDR World Conference on Disaster Risk Reduction (WCDRR), World Bank Understanding Risk forum, AGU/EGU, IGARSS, ISPRS 3
Why Create Flood Maps Damaging flood events occur both over very large areas (e.g., major river valleys) and, for damage assessment purposes, small areas (e.g., urban flooding). After Hurricane Katrina (2005) along the southern Gulf Coast, USA, there was a need for very detailed, neighbourhood-level mapping in New Orleans of still-standing water over weeks of time. Yet also there was a need for an overview of the entire central Gulf coastline, as the storm had caused flooding of many small communities that were difficult to access by local authorities. NASA/NOAA collaboration producing Global Products for Regional Consumption - demonstrating how new flood data products can be generated, used, and validated through cooperation with regional and national agencies in international settings 4
Model Forecasts vs. Monitoring Nowcasts Global Flood Monitoring System (GFMS) http://flood.umd.edu/ Global Real-time Flood Calculations Using Satellite Rainfall and Hydrological Models TRMM/GPM rainfall into land surface and routing models for water depth and stream flow calculations compared to flood thresholds--every three hours TMPA TRMM calibrating rainfall from other satellites as forerunner to GPM Indus River basin Aug. 20 2013 Global Flood Detection 12 km resolution Satellite microwave-based river discharge along the Jamuna river (lower Brahmaputra) in Bangladesh, at River Measurement Site #20 (numbered red dot in previous slide). Updated September 4, 2014. NASA/JAXA AMSR-E, TRMM, and AMSR-2 37 GHz are the source data. Upper plot is most recent part of time series. Flooding is major but not, so far, as extreme as that in 2007, 2002, and 1998. Flooding shown near this site in previous slide has, based on this satellite information, a recurrence interval of ~5 yr. Note that drought/unusual low flow was occurring in spring of 2014. Experimental Inundation Mapping at 1 km resolution Time Histories at a Point • Typically models predict the amount of flooding that will occur, when it will occur, and where • Run daily to produce outputs that are low/moderate resolution • Based on geophysical parameters and inputs from satellite and ground measurements • Satellite monitoring products are moderate/high resolution from imagery • We need both cross-strapped, openly available, with legends imprinted • Graphs/histograms of what’s happening at a particular point can be produced from both for comparison with gauge data and crowd sourced validation inputs 5
Monitoring with Moderate Resolution • Sensors such as MODIS and, potentially, SUOMI-NPP VIIRS can provide a kind of flood (and surface water resources) data "infrastructure", whose strengths are temporal and spatial coverage that are a useful base for higher spatial resolution sensors. They are always on, and public; the data distribution obstacles that are sometimes present for other high resolution sensors are in this case absent. • It would be very productive if VIIRS-sourced and Landsat 8-sourced surface water information could be added as services in addition to detection of surface water extent. VIIRS would add continuity and backup (the MODIS sensors are aging); Landsat increases spatial resolution about two orders of magnitude (100 - 30 m pixels per single MODIS or VIIRS ~300 m pixel), at cost of temporal and spatial coverage. • The strength of VIIRS is that • The swath is 3000km with additional overlap between orbits (no gaps) even at the equator and with nearly constant spatial resolution across the scan (375m nadir – 750m edge of scan) • It provides daily coverage and will become the primary afternoon instrument once Aqua MODIS is retired • The problem is the mapping capability is one-off in response to individual requests from higher ups…they are not routine and are not created with end user input except in very narrow settings 6
Comparison of MODIS and VIIRS Flood Products While great strides have been made, do not take away that we’re done, the amount of the problems we are facing and the urgency with which they need to be dealt are still daunting if we want to be serious about providing societal benefits to humanity at large in the near future. • Issues with clouds and cloud shadows on single images • Clouds can be detected and removed, but MODIS cloud mask is 1km resolution for corresponding flood images at 250m • Composites over multiple days show better water detection • Cloud shadows still problematic, shadows are detected as open water, but approaches exist such as height above nearest drainage (HAND) using DEM (e.g., Hydrosheds90mSRTM) in addition to other geometric (height vs. sun angle) techniques • VIIRS NOAA GMU (VNG) Flood Algorithm (VNGFLOOD) resolves most of the cloud shadowing issues (better resolution cloud mask plus combination of geometric and HAND approaches) • VIIRS products are being proven more recently in a “data rich” environment (e.g. USA) where ground truth matching is being demonstrated - then we purvey them to our international partners and enlist them in ground truthing exercises in local settings 7
Higher spatial resolution VIIRS and better handling of cloud shadows provides better coverage than MODIS Bangladesh, August 29, 2014, Left: VIIRS, right: MODIS 8
VIIRS Flood Map from Namibia May 20 2014TIF format, 9.5Mbytes 9
Example of Vectorized VIIRS Flood Map https://api.tiles.mapbox.com/v4/cappelaere.9bf94354/page.html?access_token=pk.eyJ1IjoiY2FwcGVsYWVyZSIsImEiOiJxSjM5MEt3In0.9PYNJ8PzRclvtEh1jkqBuA#8/-16.093/23.898 (from Namibia May 20 2014 image) The compressed topojson file is only 161KB published on Mapbox using a simplistic base map. But you get a better idea of impact of flood on zoomable map. A real publisher would publish the data on request against a terrain map and with a legend and embedded tags to enable the sharing on Facebook/Twitter 10
Landsat-8 Surface Water Also Northwestern Namibia (Zambezi River) May 20 2014 12
Geo-Social Sharing of Science Data Easy data dissemination, visualization and sharing Facebook Twitter 13
Example of Vectorized Frost Product for Kenya This data set comes from MODIS night time land surface temperature (LST) https://api.tiles.mapbox.com/v4/cappelaere.3107bfe3/page.html?access_token=pk.eyJ1IjoiY2FwcGVsYWVyZSIsImEiOiJxSjM5MEt3In0.9PYNJ8PzRclvtEh1jkqBuA#8/1.368/38.276
NOAA JPSS Satellite ApplicationsRiver Ice and Flooding Application for NWS Societal Impacts JPSS Capabilities – River Ice and Flooding Product Frequent passes at high risk polar latitudes High VIIRS spatial resolution (375m) Near real time flood detection at regional scale in the USA Event-driven flood detection at global scale Case-driven high spatial resolution (from 10m to 30m) flood map generation using digital elevation models Effective algorithms available in direct broadcast • Floods are one of the most common hazards in the U.S. • Coast-to-coast threat to the U.S. and its territories year round. • More than 8 million people live in areas at risk of coastal flooding • Strong need for near-real-time monitoring the evolution and dynamics of ice cover due to: • High frequency of river ice related events • Significant risk of damages • Accurate and detailed information on ice conditions is necessary for: • Better flood risk assessment • Timely issuance of flood warnings • Faster preventive or mitigation measures VIIRS ice-jam flood detection in Galena, AK during May, 2013 Capabilities Needed • Evaluate state of river ice to prepare for break-up • Identify flooding caused by ice jam or rainfall in remote and urban areas • Estimate extent and depth of flooding waters
River Ice and Flooding Initiative • NOAA JPSS River Ice and Flood Project Initiative began in Nov 2013 • Initiative Objectives • Test new VIIRS River Ice and Flooding Products in operational River Forecast Center (RFC) environments • Algorithms developed by NOAA JPSS Proving Ground Program • Determine the value of these products in their use in response to real-world ice jam and flooding events • Implement procedures to transition these research capabilities to operations • Initiative has high interest in NWS River Forecast Centers (RFCs) • Alaska-Pacific and North Central RFCs partners in initial actions • Northeast and Missouri Basin RFCs new 2014 partners • Two more RFCs considering joining the initiative • Products available from Direct Broadcast data through The Community Satellite Processing Package (CSPP) from direct readout in Univ. Alaska Fairbanks and University of Wisconsin, to RFC AWIP Systems • Products evaluated during Winter 2013-14 Project • Flooding Product has been applied year-round to US and international river basins (Paraguay request)
Chena River Flooding 4 Jul 2014 A significant flood occurred in the eastern Tanana basin, including the Chena River near Fairbanks AK Alaska Pacific RFC Validation of GMU River Flooding Product Moose Creek Flood Control Dam Project is Heavy Precipitation Rise in the River Chena River Fairbanks GMU flood product detection Flooding Verification GMU River Flood Product Tanana River
Summary • Flood maps are useful to disaster managers, civil protection, and the public at large, but are still not being provided routinely or made available from open repositories • We can brag about the accomplishments, but need to emphasize the problems and why they are significant. • We do need near realtime flood extents but we also need to composite the results with other products and models. • We need automation for that... which means we need to have an API in place to generate those products on-demand • We need to address product delivery to "disadvantaged" end-users (and not just scientists with high-end software) • We need to address mobile platforms access and visualization with common open tools that users already have • We need to figure out a way to fund incorporation of new capabilities (better DEMs, new radar satellites, high res optical, etc…) into a seamless stream of delivery that can inform situational awareness for affected users 19
Conclusion • NASA/NOAA collaboration has worked well and been demonstrated with both national and international flooding events • That collaboration needs to be nurtured with further interactions on national and international fronts exploiting in-roads made through CEOS, GEO, SERVIR, and other foreign, regional, and international agencies to expand access to and use of products, return of validation results, and implementation of further product improvements • Thank You 20